Ethereum ETH/USD was falling over 10% lower at one point on Friday in sympathy with the general markets where the SPDR S&P 500 SPY declined as much as 1.69% intraday following an abysmal jobs report.
Ethereum had been holding up strong in comparison to the stock market, rallying 18% between Saturday and Wednesday to reach a high of $4,784.50, which is just 1.74% below the Nov. 10 all-time high of $4.867.81. On Friday, possible market fear set in and began to drag the crypto down with it.
The pullback may be necessary to confirm a trend change, as long as Ethereum remains above a key level. If the level is lost, however, the crypto could be in for a much larger fall.
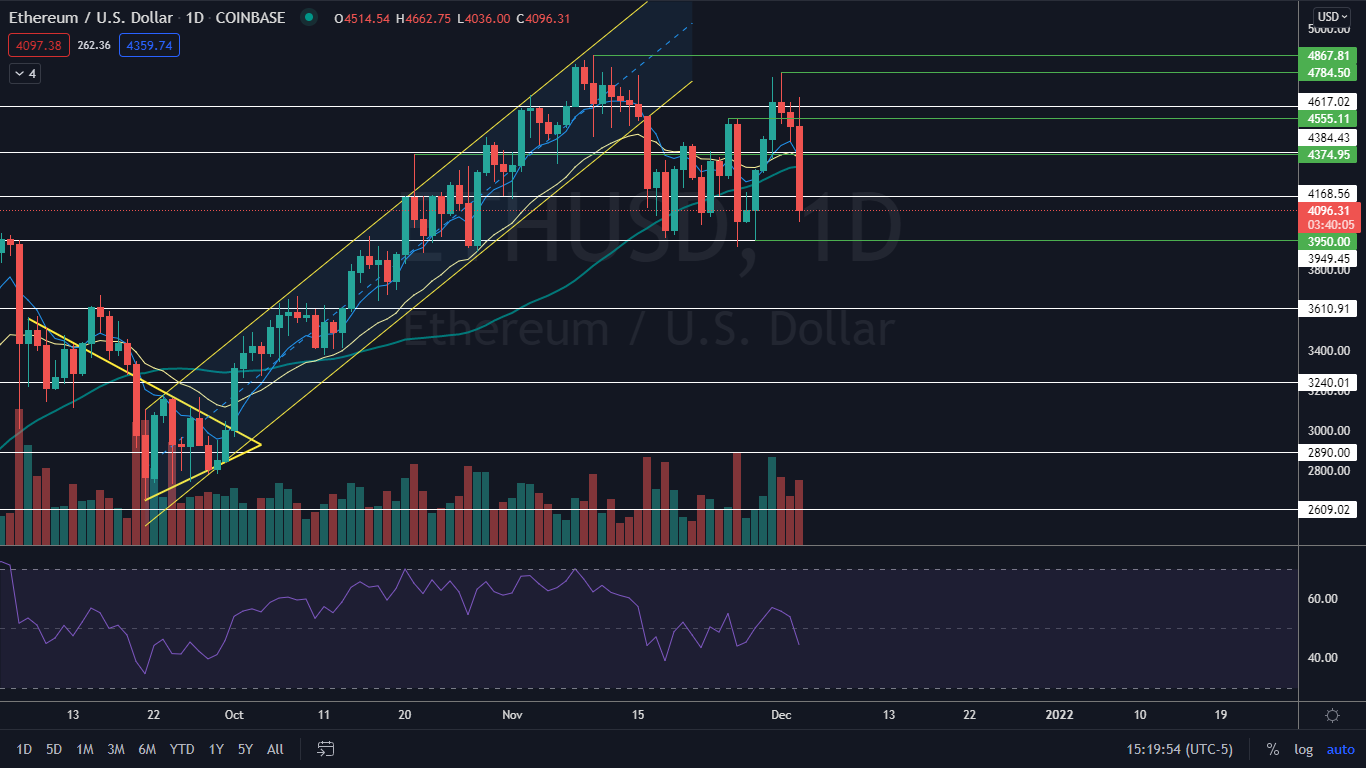
The Ethereum Chart: Ethereum printed the first sign of an uptrend on Tuesday and Wednesday by rising up over a previous higher high formed on Nov. 25 and Nov. 26 near the $4.555 level. The crypto has not printed another higher low since Nov. 28 and as long as Ethereum remains above the $3,950 level the uptrend will remain intact.
Bulls may want to watch for a reversal candle above the level to print over the coming days, such as a hammer candlestick on a doji on the 24-hour chart to gauge whether a higher low has been set. Ethereum’s daily candle on Friday indicates lower prices may come on Saturday, however, before any potential bounce due to the high level of bear volume on the move lower.
By midafternoon Ethereum’s daily trading volume was measuring in at about 216,000 compared to the average 10-day trading volume of 172,802. When a stock or crypto moves lower on higher-than-average volume it indicates traders and investors have become fearful.
On the weekly chart, Ethereum looks to have printed a bearish double top pattern at the $4,777 level when the high of the current week is paired with the week beginning Nov. 22. If the double top pattern is recognized Ethereum could suffer a bearish period next week.
Ethereum is trading below the eight-day and 21-day exponential moving averages (EMAs) but with the eight-day EMA and 21-day trending inline. If the eight-day EMA crossing below the 21-day it will be bearish. On Friday, the crypto lost support at the 50-day simple moving average, which indicates longer term sentiment has turned bearish.
Want direct analysis? Find me in the BZ Pro lounge! Click here for a free trial.
- Bulls want to see Ethereum hold above the most recent higher low and for the crypto to consolidate sideways on low volume while printing a reversal candlestick. The crypto has resistance above at $4,384 and $4,617.
- Bears want to see sustained big bearish volume drop Ethereum down to make a lower low to negate the uptrend. There is support at $3,950 and $3,610.

© 2024 Benzinga.com. Benzinga does not provide investment advice. All rights reserved.
Comments
Trade confidently with insights and alerts from analyst ratings, free reports and breaking news that affects the stocks you care about.