The two cryptocurrencies have many similarities, and supply-demand differences.
Since their respective launches in 2009 and 2014, bitcoin and ether have become the two main cryptocurrencies. Moreover, since CME Group introduced the first bitcoin futures contract in December 2017, and ether futures contract in 2021, both have become more consistently positively correlated (Figure 1) with one-month rolling correlations varying from +0.35 on the low to nearly +1 on the high end.
Figure 1: Bitcoin-Ether correlation has been more consistently positive since early 2018

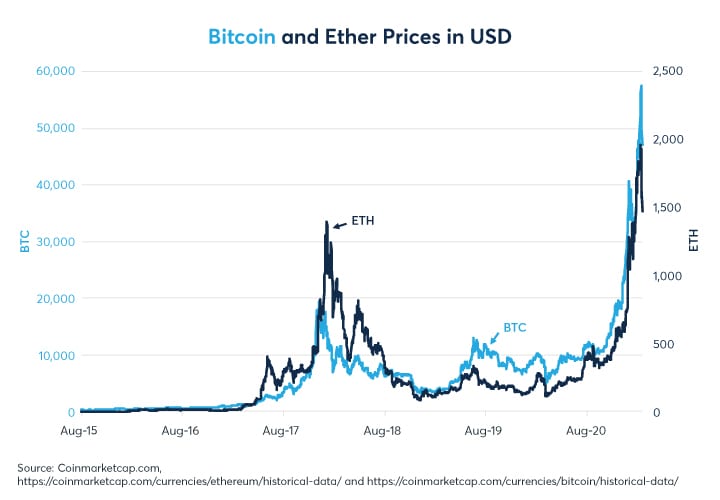
Since the summer of 2018, the close co-movement of the two cryptocurrencies has become readily apparent (Figure 2). They both fell in 2018 and traded sideways in 2019 and early 2020 before rallying together in late 2020 and in early 2021.
Figure 2: Since 2019 Ether and Bitcoin prices have tracked each other reasonably closely
Bitcoin was designed as a digital currency to act as a store of value and medium of exchange. Since its launch, its attributes as a gold-like store of value and inflation hedge has dominated its role as a medium of exchange due to its limit on eventual supply.
By contrast, ether enables the Ethereum network, an open-ended, decentralized, blockchain-based public software program that facilitates peer-to-peer contracts known as smart contracts, as well as decentralized applications known as DAPPS. Smart contracts allow users to exchange value and are written in code rather than human languages to avoid ambiguity. DAPPS can make use of smart contracts on the Ethereum network to achieve decentralization. The Ethereum network enforces that all operations on the data happen according to the smart contract code, allowing the data to maintain its integrity without a trusted third party acting as an intermediary.
See also: How to Buy Bitcoin (BTC)
Bitcoin and ether have many similarities, in that they both rely on the health of the networks that support them. That said, there are important supply- and demand-side economic differences between them:
- Bitcoin supply is limited to 21 million total coins; the number of ether is unlimited
- Annual creation of ether is limited to 18 million coins; bitcoin’s creation halves every four years
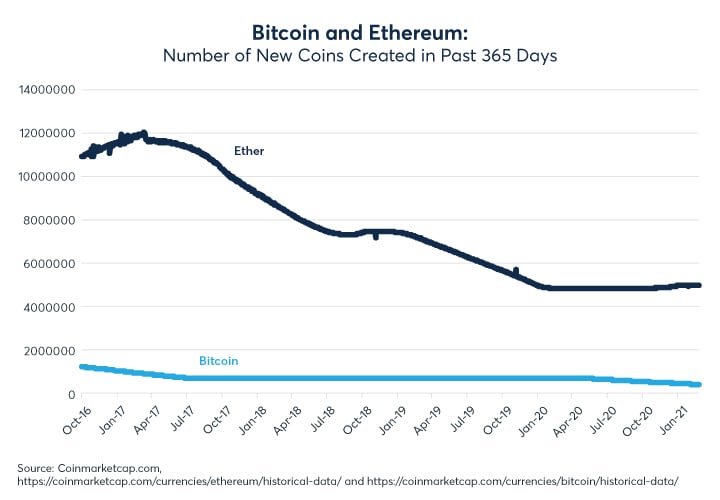
- 4,957,255 Ethereum coins were created in the past 365 days compared to just 418,450 bitcoin
- Ether was first distributed via an ICO, with 20% of launch coins going to the Ethereum Foundation. Bitcoin was launched from open source software more than five years before ether came into existence. Up to 5% of bitcoin may been mined by its creator.
- Owing to its first mover status from 2009, bitcoin continues to enjoy a strong incumbency advantage over most rival cryptocurrencies. Ether, launched in 2014, relies on the growth of its developer network for smart contracts and DAPPS. The Ethereum network’s promoters see it as a blockchain 2.0, an updated version of the bitcoin blockchain that is goes beyond being a store of value.
ETH versus BTC: Does relative supply drive the price?
Each year far more ether coins are created than bitcoin (Figure 3). In fact, the ratio of new ether versus new bitcoin created over any 365-day period since 2016 has varied between 7x and 16.5x.
Figure 3: Far more ether coins are created each year than bitcoin, but the ratio changes over time
Is relative supply of ether and bitcoin a driver of the ether/bitcoin exchange rate? For example, when ether is created more rapidly versus bitcoin, does that devalue ether in terms of bitcoin? Or put another way, when the creation of ether accelerates does it cause ether prices to fall relative to bitcoin? The answer appears to be no. In fact, since October 2016, ether prices have often been highest in terms of bitcoin when the creation of new ether was at its highest level as a ratio to the creation of new bitcoin. As such, it seems that a high price of ether relative to bitcoin encourages the creation of more ether on the Ethereum network rather than many new ether coins depressing the price of ether relative to bitcoin (Figure 4).
Figure 4: High ether prices relative to bitcoin appear to incentivize the Ethereum network’s growth

In 2017, ether rose as high as 0.15 bitcoin. During this bull run, the ratio of new ether supply to bitcoin supply increased from 9x to over 16x. Then, as ether prices fell versus bitcoin in 2018 and 2019, the supply of new ether versus new bitcoin fell to as low as 7x. Recently, ether prices have begun to recover versus bitcoin and the ratio of new ether to new bitcoin supply has risen back toward 12x.
Market perceptions of risk
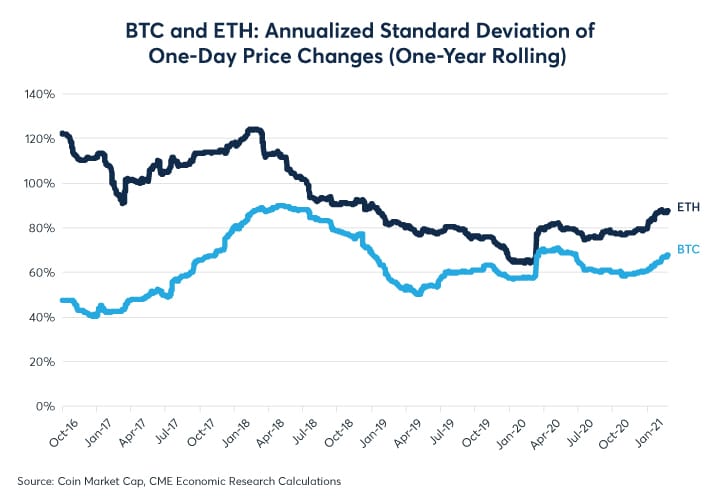
Since its inception, ether has been consistently more volatile than bitcoin. The ratio of ether’s volatility versus that of bitcoin has, however, fallen since early 2018. For much of 2017, ether was roughly twice as volatile as bitcoin, but since early 2018, the ratio of the two cryptocurrencies’ volatility (as measured by the annualized standard deviation of daily returns for the past year) has fallen from 2x to around 1.25x (Figure 5). With its higher volatility and usually positive correlation to bitcoin, ether could be understood as a “high beta” version of bitcoin (to borrow a term from the equity universe). That said, as can be seen in Figure 4, the price of ether can still move considerably relative to bitcoin.
Figure 5: Ether has been consistently more volatile than bitcoin but their volatilities are converging
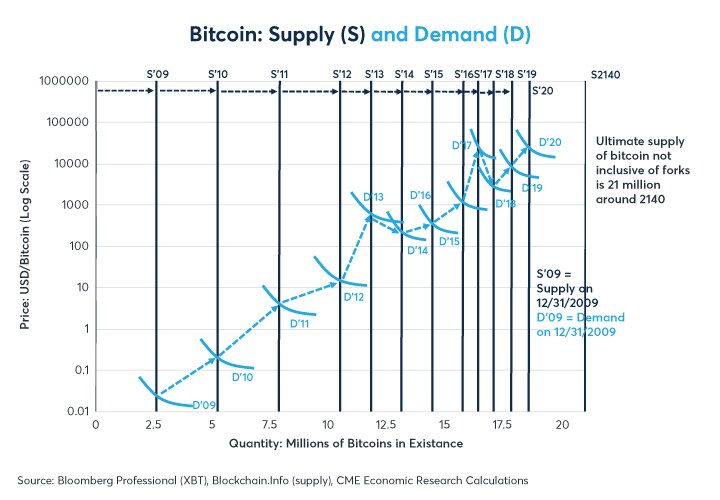
Bitcoin’s exceptionally high volatility is due in part to bitcoin’s near complete inelastic supply. No matter how high the price rises or how low it falls, the total number of bitcoins never changes (Figure 6).
See also: How to Buy Ethereum (ETH)
That ether supply creation appears to respond to price, and is hence more elastic than bitcoin supply, does not appear to have dampened ETH’s price volatility. This implies that either demand for ether must be more volatile than demand for bitcoin or ether is subject to greater swings in demand than BTC is.
Figure 6: No matter what happens to the price of bitcoin, the eventual supply stays the same
The price of bitcoin may be influenced by the cost of verifying transactions. Past spikes in “cost per transaction” in 2010, 2013 and 2017 presaged sharp falls in the price of bitcoin. Some of those declines in bitcoin prices were greater than 80% from peak to trough (Figure 7). In terms of ether prices, it is worth pointing out that prices fell sharply in bitcoin terms around the time that bitcoin cost per transaction peaked in 2017 and fell even further than BTC did in percentage terms versus fiat currency terms. As such, investors in ether may wish to keep an eye on the cost per transaction of bitcoin even if they are only exposed to ether and not bitcoin.
Figure 7: Do rising transaction costs choke off demand for cryptocurrencies?

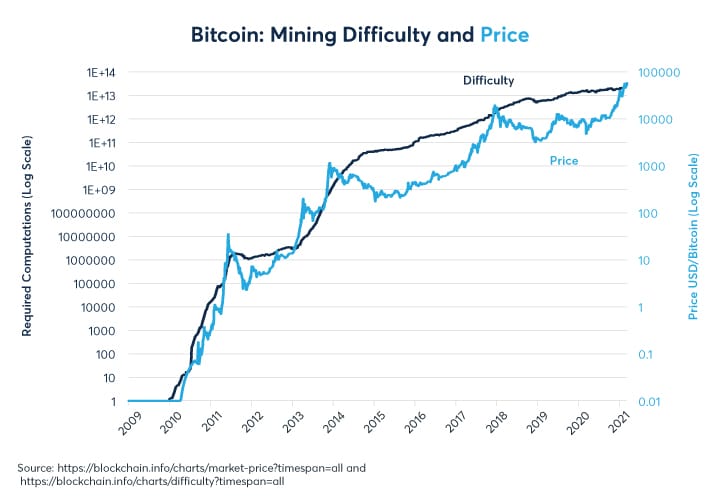
Finally, in commodity markets like oil, gold and agriculture, one common assumption is that prices cannot durably fall below the cost of production. In the world of cryptocurrencies, the number of calculations needed to create a bitcoin and an ether might serve as a proxy for their cost of production. For the moment, it remains unknown whether the increased difficulty (meaning greater number of calculations) needed to create new ether or bitcoin coins will serve as a sort of soft floor under the price of cryptocurrencies in the future. It is also worth noting that the increase in difficulty and price have both slowed significantly in log terms since 2015 (Figure 8).
Figure 8: Will the growing difficulty of mining new coins support prices over the long term?
To learn more about futures and options, go to Benzinga’s futures and options education resource.
© 2024 Benzinga.com. Benzinga does not provide investment advice. All rights reserved.
Trade confidently with insights and alerts from analyst ratings, free reports and breaking news that affects the stocks you care about.

