
BTC/USD Technical Analysis: Could this chart pattern forecast a price rise?
Bitcoin pulled back from some of the losses seen on recently and picked up on Wednesday.
Now on Thursday, the price has consolidated into a bull flag formation you can see on the chart below.
If the pattern breaks it could indicate some more bullishness on the horizon.
%20(16)-637123702178595431-637123816135892470.png)
ETH/USD Technical Analysis: Price has moved into a tight intraday consolidation area
Ethereum has moved into a tight zone between 125.70 and 128.60.
The key point will be any potential breakout.
The support is right at the bottom of the chart near 116.25, while the resistance is the consolidation high at 134.81.
The RSI is mid-range and not offering many clues at the moment and the volume is also low.
%20(1)-637123763136786424-637123816314645853.png)
Litecoin Technical Analysis: LTC/USD bears are back in full control
Litecoin price is trading in the green in the session by some 3.15%.
LTC/USD is on its way to the next major area of support down at $20.
Rallies continue to be sold given the stubborn bearish trend of which Litecoin remains within.
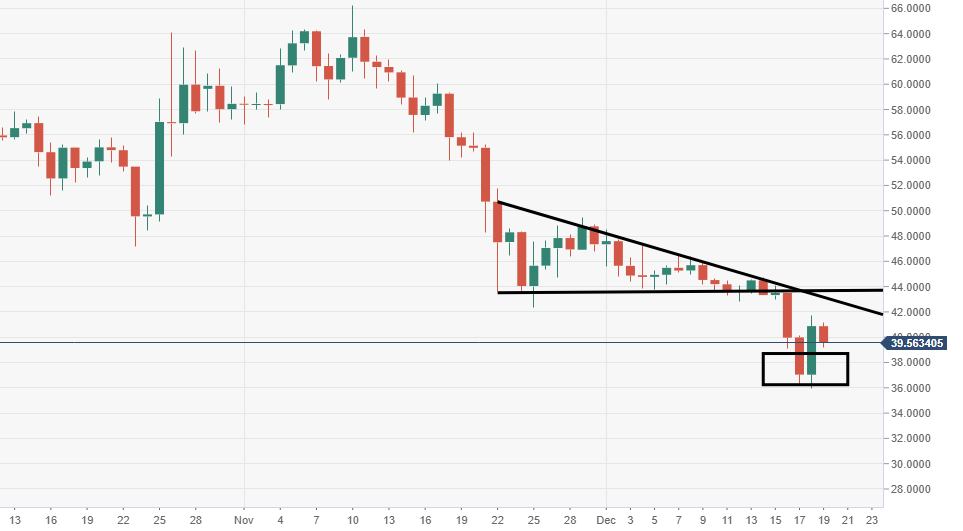
Image Sourced from Pixabay
© 2024 Benzinga.com. Benzinga does not provide investment advice. All rights reserved.
Comments
Trade confidently with insights and alerts from analyst ratings, free reports and breaking news that affects the stocks you care about.

