
- The volatility in the previous week made it difficult to sustain the price above $0.30.
- Ripple has a bearish bias in the near-term especially RSI diving sharply towards the oversold.
Ripple is extending consolidation in a wide range between $0.28 and $0.34. In fact, for more than two weeks now, Ripple stayed above $0.30 support area. There have been attempts to break above $0.34 critical level but the price ended up making lower price actions.
The volatility in the previous week made it even more difficult to sustain the price at $0.30. However, the bulls woke up this week sending XRP/USD above the 50 Simple Moving Average (SMA) 1-hour and the 100 Simple Moving Average (SMA) 1-hour.
The immediate upside is capped at $0.32 in addition to the trendline resistance as observed on the hourly chart. On the downside, both the moving averages stand in line to anchor the losses. Ripple has a bearish bias in the near-term especially with the Relative Strength Index (RSI) diving sharply towards the oversold.
On the positive side, the Moving Average Convergence Divergence (MACD) sits above the mean line (0.000). Moreover, the ranging trend suggests continued consolidation whose constriction would squeeze through $0.32 hurdle.
XRP/USD 1-hour chart
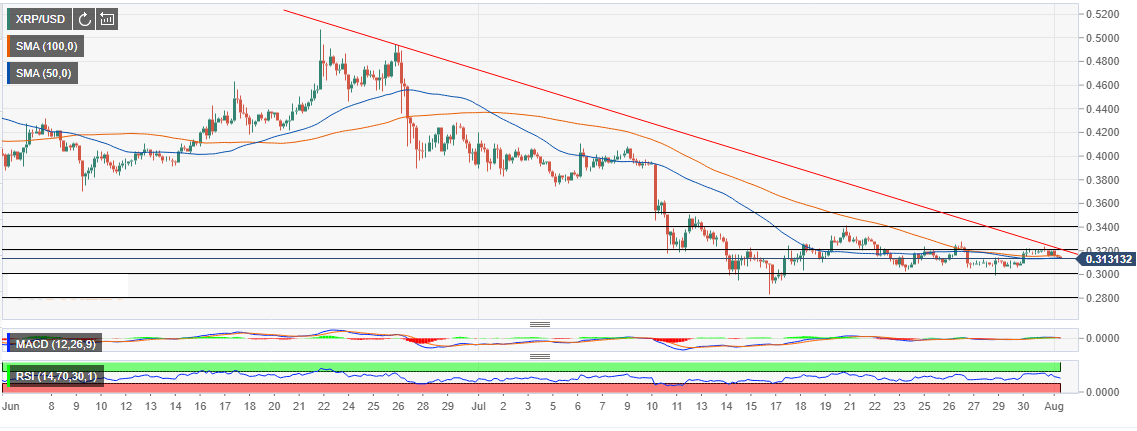
Image Sourced by Pixabay
© 2024 Benzinga.com. Benzinga does not provide investment advice. All rights reserved.
Comments
Trade confidently with insights and alerts from analyst ratings, free reports and breaking news that affects the stocks you care about.

