


(Thursday market open) One day before this data-packed week hits its crescendo with August jobs data, a key U.S. inflation barometer delivered results in line with Wall Street’s forecasts. Both stocks and Treasuries added to recent gains in premarket trading immediately following the numbers.
The government said early Thursday that July Personal Consumption Expenditure (PCE) prices and core PCE prices both climbed 0.2% month-over-month, in line with the average analyst estimate. Personal spending rose a stronger-than-expected 0.8%, while personal income rose 0.2%, below the 0.3% average estimate.
Looking ahead to Friday, analysts expect jobs growth of 170,000, down from 187,000 in July. The jobs report, including its wages component, could play into the Federal Reserve’s approach to its next meeting later in September.
The S&P 500® Index (SPX) enters the final day of August on a four-session win streak that on Wednesday powered the index to its best close since August 7. Though it’s still down 1.6% for August, it’s up 3.3% since the August closing low below 4,400 posted August 18.


Morning rush
- The 10-year Treasury note yield (TNX) inched lower to just under 4.11% after the PCE data.
- The U.S. Dollar Index ($DXY) clawed higher to 103.53.
- Cboe Volatility Index® (VIX) futures slipped to 13.82 following the PCE data.
- WTI Crude Oil (/CL) futures are up for the sixth-straight session at $82.54.
Just in
Year-over-year PCE prices rose 3.3%, up from 3% in June but in line with Wall Street’s average estimate, the government said. Core PCE rose 4.2% year over year, up from 4.1% in June.
The slight acceleration in annual PCE and core PCE might catch some attention, as both remain well above the 2% Federal Reserve goal. However, core PCE had been hanging out in the 4.5% to 4.6% area for months before June, so this could be seen as progress compared to that.
Diving deeper into the report, PCE prices fell 0.3% for goods from June but rose 0.4% from services, continuing the trend toward services inflation driving price increases even as goods see signs of deflation.
Even before the U.S. inflation news there were price tidings today from across the Atlantic, where European inflation remains stubborn. August Euro-area CPI and core CPI both came in at 5.3% year-over-year. Even though core has come down over the past few months, it was at 5.3% in January, so there hasn’t been much progress. “That’s disappointing news for the for the European Central Bank (ECB) given the worsening growth profile for the broader area,” says Kevin Gordon, of the Schwab Center for Financial Research.
And one day ahead of the U.S. August jobs report, monthly job cut announcements for August rose 267% year-over-year versus -8.2% in the prior month, according to Challenger. Warehousing led all industries in terms of cut announcements, with a lot of that driven by the bankruptcy of trucking company Yellow Corp.
Meanwhile, economic news from China early today showed its August manufacturing PMI improving slightly but remaining in contractionary territory for the fifth straight month. Services activity eased, too, but remains at the low end of expansion.
Stocks in spotlight
Broadcom AVGO earnings are due this afternoon following the close. Last time the chip company reported, its shares jumped as investors cheered the company’s positive forward guidance—forecasting fiscal Q3 revenue of $8.85 billion. There’s a school of thought that suggests Broadcom and competitor Nvidia NVDA have the most to gain from the surge in AI semiconductor demand and shares of both certainly reflect that so far this year.
Salesforce CRM shares got a nice lift in premarket trading after the cloud-based enterprise software company reported better-than-expected earnings late Wednesday and delivered a buoyant outlook. The company, which referred to itself in its earnings press release as the ”#1 AI CRM” (customer relationship management), saw an 11% year-over-year revenue gain.
What to watch
Jobs on deck: Everything builds up this week to Friday’s August Nonfarm Payrolls report. Consensus on Wall Street, according to Trading Economics, remains at 170,000 jobs added, down from 187,000 in July. At 170,000 or anything below, jobs growth would be close to a three-year low.
Hourly earnings are also a key factor to watch after strong 4.4% year-over-year growth in July. Analysts expect a repeat of that in August, and recent strike settlements with their associated pay raises could be a factor continuing to push wages higher.
“A stronger-than-expected jobs report Friday would boost the odds of another Fed rate hike and may put downward pressure on stocks,” says Liz Ann Sonders, Schwab’s chief investment strategist.
August’s jobs report traditionally has a lot of “noise” because it coincides with back-to-school season when many educators jump back into the workforce. This can sometimes skew the data for a month or two, so it wouldn’t be surprising to see revisions in the September report. Keep an eye on any revisions to July’s report, too, which would be characteristic in a year that’s seen some dramatic adjustments by the government to previous jobs data.
Here is the Trading Economics’ consensus for tomorrow’s Nonfarm Payrolls, due at 8:30 a.m. ET:
- August jobs growth: 170,000, down from 187,000 in July
- August unemployment rate: 3.5%, unchanged from July
- August monthly average hourly earnings: +0.3%, down from +0.4% in July
- August annual average hourly earnings: +4.4%, versus +4.4% in July
Eye on the Fed
As of this morning, the probability that the Federal Open Market Committee (FOMC), the Fed’s policy-setting arm, will maintain current rates after its September 19–20 meeting was 90%, according to the CME FedWatch Tool. Expectations that rates will be higher coming out of the FOMC meeting in November reached 44% this morning.
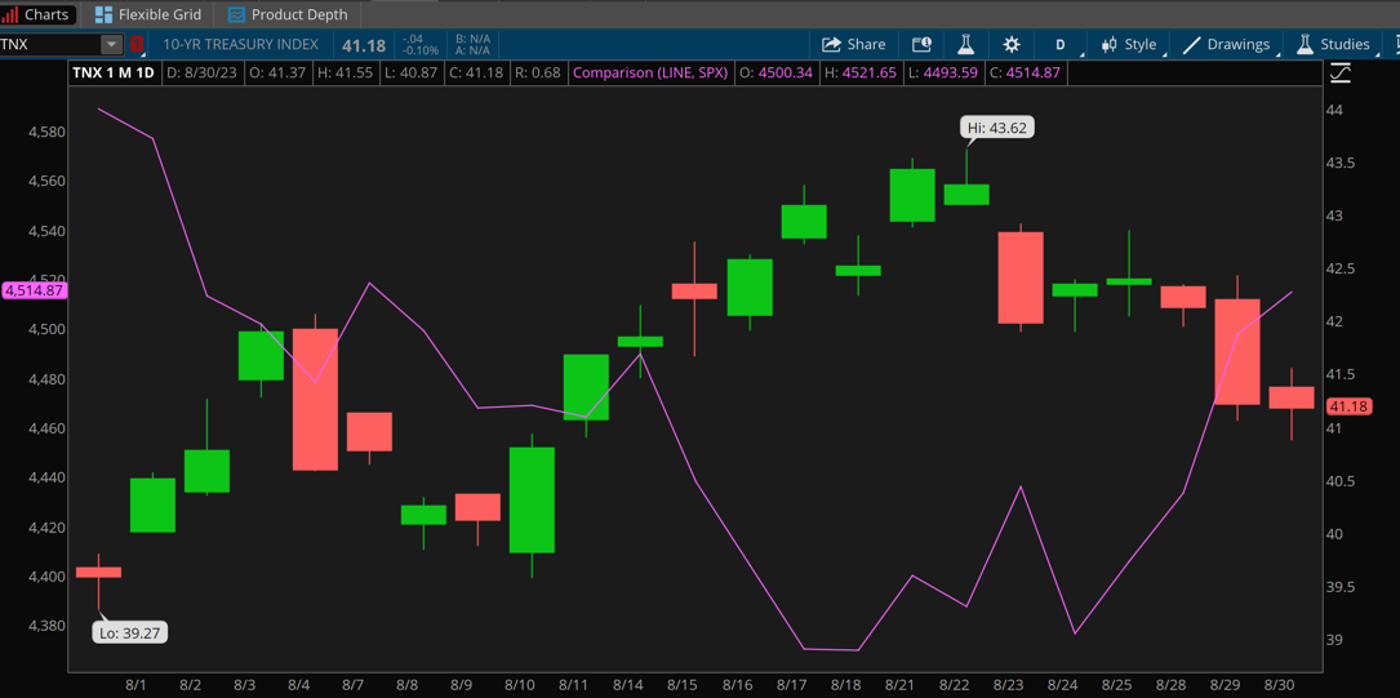
CHART OF THE DAY: CALLING THE SHOTS. This one-month chart comparing the 10-year U.S. Treasury yield (TNX—candlesticks) to the S&P 500 Index (SPX—purple line) makes it clear that stocks are taking their marching orders from the fixed income market. The recent dip in yields back toward lows last seen in early August coincides closely with Wall Street’s four-day rally. Data sources: S&P Dow Jones Indices, Cboe. Chart source: thinkorswim® platform. For illustrative purposes only. Past performance does not guarantee future results.
Thinking cap
Ideas to mull as you trade or invest
Factory gates: Tomorrow also brings the August U.S. Institute for Supply Management (ISM) Manufacturing PMI, and analysts expect it to remain in contraction at 47, according to consensus from Trading Economics. That would be up from 46.4 in July, but anything below 50 signals contraction. The U.S. factory economy has suffered nine straight months under 50, with demand remaining weak in July, according to ISM.
What ADP tells us: The ADP jobs data is a report everyone tends to write off—at least until it hits the tape and the market moves on the numbers. Weaker-than-expected ADP data yesterday gave Wall Street an early boost on hopes that pressure on the Fed might ease. Don’t expect the ADP data—which tracks private sector labor trends—to offer a preview into Friday’s Nonfarm Payrolls report. ADP has missed the government’s number by an average of 129,000 jobs a month over the last year. Still, it’s possible to extract something from the discrepancy if you play with the numbers. The ADP report showed 177,000 jobs created in August. Adding and subtracting the average 129,000 miss to that number gives you a range from 48,000 to 306,000. The middle falls at 170,000—Wall Street’s consensus estimate for Nonfarm Payrolls! “And that’s a good thing in my opinion,” says Randy Frederick, of the Schwab Center for Financial Research. “On-target data is what the market wants right now.” Check back Friday and see if the ADP report proved helpful.
Tis the season: This week’s positive streak notwithstanding, August has generally lived up to its reputation as one of the weakest months of the year. Unfortunately, September begins tomorrow and it’s another historically soft month for Wall Street. Of course, seasonal factors aren’t predictive, which is why investors can’t count on the market to revive in October simply because that’s the historic pattern. So far, this has been a “year of investing cliches,” Schwab’s Chief Global Investment Strategist Jeffrey Kleintop points out. One of those cliches is that a strong January tends to set up a strong year. So far, that one holds up despite any barking you might hear in these late-summer dog days.
Calendar
Sept. 1: August Employment Report, Construction Spending, and the Institute for Supply Management Manufacturing Index.
Sept. 4: U.S. markets are closed for Labor Day.
Sept. 5: July Factory Orders and expected earnings from GitLab Inc. (GTLB) and Zscaler Inc. (ZS).
Sept. 6: MBA Mortgage Applications Index, Trade Balance for July, Institute for Supply Management Non-Manufacturing Index for August, Fed’s Beige Book.
Sept. 7: Nonfarm Productivity and Unit Labor Costs for Q2.
TD Ameritrade® commentary for educational purposes only. Member SIPC.
Image sourced from Shutterstock
This post contains sponsored content. This content is for informational purposes only and not intended to be investing advice.
Edge Rankings
Price Trend
© 2025 Benzinga.com. Benzinga does not provide investment advice. All rights reserved.
Trade confidently with insights and alerts from analyst ratings, free reports and breaking news that affects the stocks you care about.

