


(Thursday market open) ) Despite mixed inflation data, major indexes initially moved higher this morning as investors seemed encouraged by a lack of negative surprises in the report.
The eagerly awaited July Consumer Price Index (CPI) came in right down the middle on Thursday. Both headline and core readings rose 0.2%, in line with Wall Street’s expectations. In one positive sign, annual headline inflation rose 3.2%, below the 3.3% analysts had expected.
Treasury yields initially fell after the news broke, but then began creeping up. They could be worth tracking as the market digests today’s numbers. In sum, this CPI report might be one that’s quickly looked at and tossed away, considering that the data met expectations and there’s another CPI report and a monthly jobs report between now and the next Federal Reserve meeting in September.
There’s no rest for inflation-focused investors. The July Producer Price Index (PPI) will update Wall Street on wholesale price growth, which has unraveled faster than growth of consumer prices and sometimes can be a leading indicator for what consumers will pay down the road. The report is due out at 8:30 a.m. ET on Friday.
Major indexes fell to four-week lows yesterday, and the selling picked up pace in the final 30 minutes of the session. Technically, that tends to be bearish. The PHLX Semiconductor Index (SOX) fell nearly 2% to its weakest finish in more than a month, hurt in part by fresh signs of lethargy in the Chinese economy. Mega-caps Apple AAPL and Microsoft MSFT can’t catch a break so far this month, with both down sharply from their recent all-time highs. Regional banks also slipped after Moody’s downgraded several of them earlier this week.
The tech sector arguably has more bad news to wrestle with this morning after the Biden administration announced new restrictions on U.S. investments in China, a policy that will affect semiconductors and some artificial intelligence systems, according to media reports. Despite that, chip stocks found their footing in premarket trading, perhaps because the order doesn’t take effect until 2024.


Morning rush
- The 10-year Treasury note yield (TNX) fell one basis point to 3.99% and was relatively stable after CPI.
- The U.S. Dollar Index ($DXY) eased to 102.04 after the CPI report.
- Cboe Volatility Index® (VIX) futures dropped to 15.27, the lowest in nearly a week.
- WTI Crude Oil (/CL) continued climbing and now trades at $84.35 per barrel, near its 2023 high.
Just in
The CPI data showed 90% of rising prices connected with costs for shelter in July. At the same time, declines continued in areas that were already softening: Airfare fell 8.1% for the second month in a row; used cars fell 1.3% and new cars slipped 0.1%. However, food costs jumped 0.2% in July, up from 0.1% in June.
Stubbornly high rental costs continue to drive overall inflation—a surprise considering economists have long predicted their fall. This report did nothing to solve that particular puzzle. In addition, if non-housing core services inflation is stabilizing around the 4% annualized rate shown in this report, “the Fed isn’t likely to declare ‘mission accomplished’ so soon,” says Kevin Gordon, senior investment strategist at the Schwab Center for Financial Research.
Weekly initial jobless claims also bowed Thursday, with a higher-than-expected reading of 248,000—the worst since July 1. Analysts had expected 230,000. One week isn’t a trend, but keep an eye on the four-week average for any signs of a bump in claims that might suggest a slowing jobs market.
Stocks in Spotlight
Walt Disney (DIS) has had trouble pleasing Wall Street this year, if its stock price is any indication. Shares are down nearly 20% from a year ago.
The struggles continued yesterday after Disney posted fiscal Q3 earnings and saw shares fall in premarket trading. However, the stock turned around ahead of today’s opening bell to post gains, with investors apparently encouraged by the company’s decision to hike prices for ad-free subscriptions to its Disney+ streaming platform and its announcement that it’s on track to reach cost-savings goals.
Analysts called it a mixed quarter, but there was nothing immediately suggesting this would be the report to bring back heavy buying. Earnings per share (EPS) beat the average analyst estimate, but revenue fell short.
On the plus side, the company’s video streaming losses narrowed. This could indicate that recently implemented cost controls have had an impact, the Wall Street Journal notes. Disney also enjoyed another quarter of double-digit growth in its theme parks business, which has been rolling along since pandemic restrictions ended. Still, the Disney+ steaming business saw a 7.4% sequential loss in subscribers. The traditional television business continued to struggle.
In other earnings news, shares of Chinese e-commerce company Alibaba BABA surged 3% in premarket trading after Alibaba posted a solid profit increase despite China’s sluggish economy.
What to Watch
Bright and early: July PPI follows a June PPI report that might have had some people feeling like it was 2019 all over again. PPI that month came in near the 2% level the Fed’s been targeting, suggesting that companies face less pricing pressure for the goods they purchase. The real standout was just a 0.1% annual rise in PPI—the lowest since the autumn of 2020. While headline PPI will likely rise more than that in July because of rising fuel prices, any downward move in the core reading could suggest that easing on the wholesale side might eventually be passed along to consumers.
Here are the consensus estimates for PPI, according to Trading Economics:
- July PPI: 0.2%, up from 0.1% in June
- July core PPI: 0.2%, up from 0.1% in June
- July annual PPI: 0.7%, up from 0.1% in June
- July annual core PPI: 2.3%, down from 2.4% in June
In June, PPI for goods was flat from the previous month and up 0.2% for services. Costs for food and alcohol retailing, traveler accommodation services, insurance, hospital inpatient care, and airline passenger services rose in June, while the price of steel and iron scrap fell double-digits.
Sentiment time: The University of Michigan’s Preliminary Consumer Sentiment for August comes out soon after the open on Friday. Consensus is for a headline of 70.9, down from the final July figure of 71.6, according to Briefing.com. July’s final was the best since October 2021 and up from 59.2 in May, but well below prepandemic highs. Either way, data in line with consensus would still reflect historically light sentiment.
July Retail Sales data will be released next week, and it might provide more color as economists watch for any sign of services spending reaching a peak. Goods spending crested quite a while ago.
Eye on the Fed
Futures trading indicates a 9% probability that the Federal Open Market Committee (FOMC) will raise interest rates by 25 basis points at its September meeting, according to the CME FedWatch Tool. That was down from 14% yesterday before the CPI report. The probability of rates being 25 basis points higher than they are now after the November meeting is 27%
The monetary policy highlight next week will be Wednesday afternoon’s release of minutes from the July FOMC meeting, when the FOMC unanimously voted to raise rates by a quarter-point to the current target range of between 5.25% and 5.5%—the highest in more than 20 years.
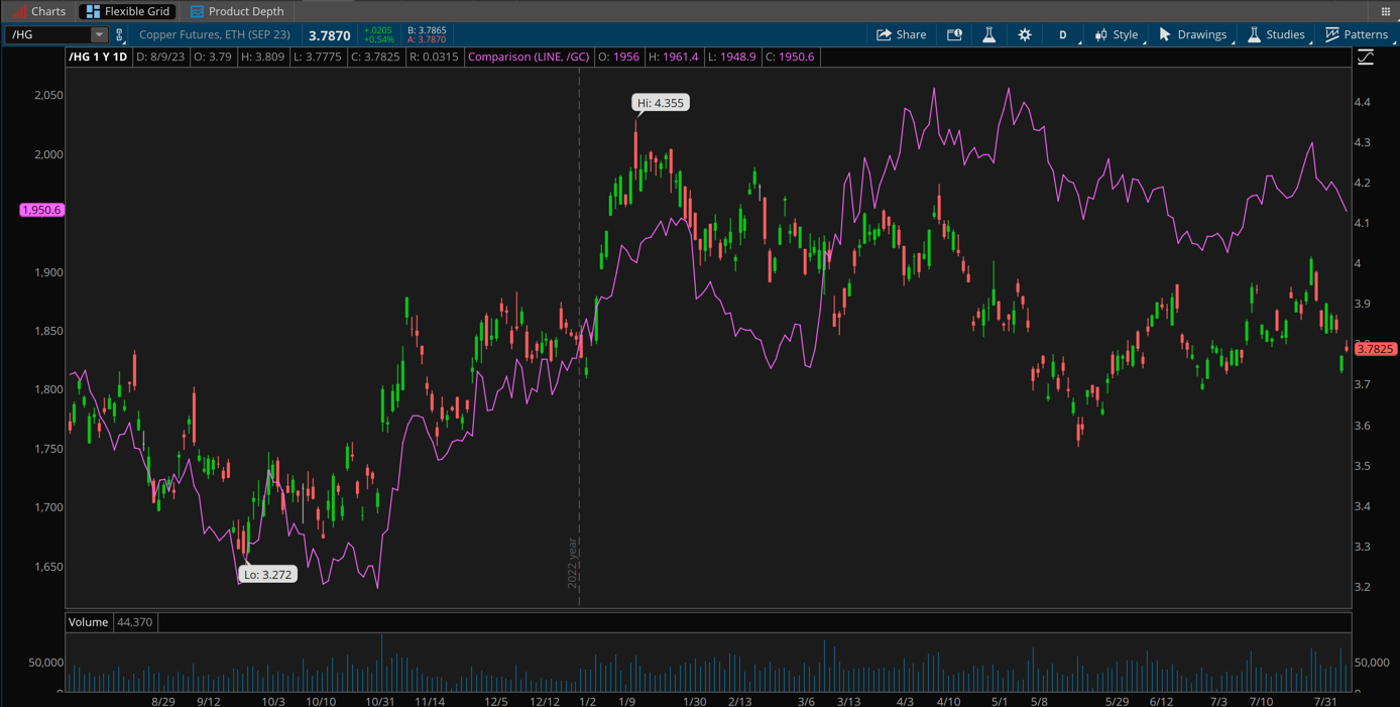
CHART OF THE DAY: HEAVY METALS. Copper (/HG—candlesticks) and gold (/GC—purple line) traded mainly in sync late last year and in early 2023, both falling as rates rose around the world and investors feared a recession that might hurt manufacturing demand. Both rebounded earlier this year as the global economy began recovering and inflation worries resurfaced. But now copper is sagging, hurt by China’s slow recovery from COVID-19, even as gold stays elevated amid ideas central banks might be close to at least pausing rate hikes. Data source: CME Group. Chart source: The thinkorswim® platform from TD Ameritrade. For illustrative purposes only. Past performance does not guarantee future results.
Thinking cap
Ideas to mull as you trade or invest
Fill ’er up: It may seem far-fetched, but the price of soybean oil you cook with might hint at the future price of gas for your car. A recent post by the CME Group, where both soybean oil and crude oil trade in the futures market, notes a “fascinating pattern” that began nearly 20 years ago in which crude oil generally follows soybean oil higher and lower in the charts. Soybean oil peaked in early 2008 and crude topped out in July 2008. Soybean oil plummeted and bottomed by December that year, and crude reached its cycle low the following February. This pattern continued more recently in 2014–2015 and last year when soy oil peaked in May before crude peaked in June. Soybean oil then soared this spring to new 2023 highs by late July. It’s fallen since. We’ll have to wait and see if crude, which reached a 2023 high of its own Wednesday, follows suit. One thing to keep in mind: Correlation isn’t causation.
Fundamental flaw? Many economists pointed to growing Chinese demand as a prime factor in crude oil’s rally from below $12 per barrel in late 1998 to above $145 per barrel by mid-2008. China is now the world’s largest importer. That’s why it seems ironic that despite the Chinese economy’s recent struggles, crude oil prices have ridden an elevator upward over the last month. The oil rally, however, hinges on other factors. “The supply side is tightening as OPEC+ leader Saudi Arabia delivers on a hefty cutback of 1 million barrels a day pledged for August and September, with a hint it could cut output even further,” notes Jeffrey Kleintop, Schwab’s chief global investment strategist. “The oil market continues to look past plenty of challenges from lingering fears of recession in G7 economies and the lackluster recovery in China to the prospect of revived supplies from Iran, Venezuela, or Iraq.”
Futures games: Front-month CME crude oil futures (/CL) reached a nine-month high above $84 per barrel yesterday and might be scaring inflation-weary (and wary) investors. While prices are up for both crude and natural gas by double digits over the last month, the futures market paints a cooler picture, pricing in much lower crude prices in coming months and years. Looking out on the CME futures curve, the market builds in mid-$60s per barrel toward 2026. The market could certainly be wrong about that, especially because crude is so heavily influenced by unpredictable geopolitical events. As for why the market is in “backwardation,” with prices for longer-term contracts lower than ones for near-term, it’s hard to say for sure. Perhaps investors hope for cooling political tensions and increased competition from electric vehicles.
Calendar
Aug. 11: July Producer Price Index (PPI), core PPI, and University of Michigan Preliminary August Consumer Sentiment.
Aug. 14: No major earnings or data expected.
Aug. 15: July Retail Sales, August Empire State Manufacturing, and expected earnings from Cardinal Health (CAH) and Home Depot (HD).
Aug. 16: July Housing Starts and Building Permits, and expected earnings from Target (TGT) and Cisco (CSCO).
TD Ameritrade® commentary for educational purposes only. Member SIPC.
Image sourced from Shutterstock
This post contains sponsored content. This content is for informational purposes only and not intended to be investing advice.
Aug. 17: July Leading Economic Indicators and expected earnings from Walmart (WMT), Applied Materials (AMAT), and Ross Stores (ROSS).
Edge Rankings
Price Trend
© 2025 Benzinga.com. Benzinga does not provide investment advice. All rights reserved.
Trade confidently with insights and alerts from analyst ratings, free reports and breaking news that affects the stocks you care about.

