


(Friday market open) Welcome signs of easing U.S. inflation propelled Wall Street to early gains Friday, but the market remains rattled following a policy tweak earlier from the Bank of Japan (BoJ) and worries about the Federal Reserve potentially tightening further.
Today’s Personal Consumption Expenditures (PCE) prices report showed the core prices rising 0.2% in June, down from 0.3% in May. That was in line with expectations and more evidence of a softer pricing environment. Core prices strip out food and energy. Core PCE rose 4.1% annually in June, down from 4.6% in May.
U.S. Treasury yields fell slightly early Friday despite the BoJ’s surprise tweak to its yield-curve control policy. The BoJ’s official 0% target on 10-year government bonds didn’t change, but it now calls the -0.5% to 0.5% range it has in place “reference points,” not “rigid limits.” The BoJ said this would give it “greater flexibility.” Economists said this was the equivalent of Japan raising the cap to 1%, and Japanese stocks declined.
Reports that Japan might make such a decision rattled U.S. stocks on Thursday as spikes across the U.S. Treasury curve seemed to spook investors. Strong U.S. economic data released early on Thursday generated additional pressure, highlighting the need for the Fed to be more aggressive in pushing growth and inflation down if they experience a resurgence, says Kevin Gordon, senior investment strategist at the Schwab Center for Financial Research.
Rising yields typically hurt growth stocks and smaller companies that may depend more on borrowing for future growth. That might explain why the Russell 2000 (RUT) small-cap index fell most dramatically yesterday. Sectors like utilities and real estate, which try to attract investors with dividend yields, also got hit by Thursday’s Treasury yield gains.
Technically, yesterday was an “outside day” on the charts for the S&P 500® Index (SPX), meaning it ventured both above the previous day’s high and below the previous day’s low. This one looked negative in that the SPX reached a peak very early Thursday and then finished sharply below Wednesday’s close, illustrating investor uncertainty. Such a move can sometimes draw technical sellers.
Morning rush
- The 10-year Treasury note yield (TNX) fell 4 basis points to 3.96%.
- The U.S. Dollar Index ($DXY) fell to 101.5.
- Cboe Volatility Index® (VIX) futures dropped to 13.51.
- WTI Crude Oil (/CL) jumped to $80.16 per barrel.
Just in
PCE prices in June rose 0.2% for both the headline and the core numbers, which is in line with Wall Street’s consensus. The core figure showed sequential improvement, falling from May’s 0.3% rise.
The core data, which strips out volatile food and energy costs, is the one the Fed watches most closely. It’s been “sticky” at 4.6% to 4.7% on an annual basis most of the year. Core PCE had been expected to rise 4.2% year-over-year in June, but slowed to just 4.1%, down from 4.6% in May. That’s likely to be seen as progress on the price front, though it remains well above the Fed’s 2% goal. Headline PCE prices rose 3% in June, down from 3.8% in May.
June Personal Income and Personal Spending also hit the tape this morning. Personal spending’s 0.5% climb was more than analysts had expected, perhaps reflecting low unemployment and improving consumer sentiment. The final July University of Michigan Consumer Sentiment report is due out after the open and analysts expect a headline of 72.6, unchanged from the preliminary July report and up from 64.4 in June, according to Trading Economics.
Wage growth was up 0.6% in June—the fastest increase since January. This is a key driver of overall income growth and speaks to resilience of the labor market. The Employment Cost Index saw a 4.5% year-over-year growth rate in June, the fastest on record aside from during the pandemic. This is probably still too hot for the Fed, which has been trying to cool the labor market.
Eye on the Fed
Futures trading indicates a 20% probability that the FOMC will raise rates at its September meeting, according to the CME FedWatch Tool. The probability for November is close to 27%. Those were basically unchanged from yesterday despite today’s data.
In one positive sign the Fed might have noted, the Q2 Gross Domestic Product (GDP) deflator, which measures inflation in the price of goods and services produced in the U.S., fell to a 2.2% annualized rate, the lowest since Q2 2020 and a sign that prices appear to be softening. It peaked at 9% in Q2 2022.
Despite that, Treasury yields rocketed on Thursday following better-than-expected U.S. Q2 GDP growth and anticipation that the BoJ might address its yield-curve control policy, which has kept yields from rising despite growth in the Japanese economy.
The U.S. 10-year Treasury note yield jumped a sharp 14 basis points Thursday to trade above 4% for the first time since July 10 after falling all the way to 3.73% on July 18. The 2-year Treasury note yield, which is more sensitive to the Fed’s rate policy, rose 9 basis points to 4.92%. If Japanese buyers stayed home to invest in their own country’s bonds, it would likely hurt U.S. Treasury prices, sending yields higher (yields move the opposite way of the underlying note’s price).
Rising Treasury yields could also indicate growing fear of another rate hike after the Fed said this week it would take a meeting-by-meeting, data-driven approach to interest rate policy. The futures market still builds in high probability of the Fed pausing in September, with a better chance that it could raise rates another 25 basis points in November. If it does so in either month, rates would reach the Fed’s projected 2023 terminal, or peak, level between 5.5% and 5.75%. They’re already at their loftiest point since 2001.
Stocks in Spotlight
The earnings car hit a few slippery spots this week. Two notable examples are the market’s disappointment with Microsoft’s MSFT cloud market outlook and a selloff of Spotify SPOT shares after the music streaming company’s earnings miss and weak guidance.
For the most part, however, it’s been a smooth road, highlighted most recently by Intel INTC and Ford F: Both surpassed Wall Street’s expectations late on Thursday and are getting premarket trading boosts.
Intel was the bigger surprise, posting a quarterly profit when analysts had expected a loss and citing its positive position to capitalize on artificial intelligence (AI) growth. The company’s cost savings plan contributed to the earnings improvement, Intel said in a press release. Like many info tech companies, it has reduced headcount over the last year.
Ford had a mostly strong quarter, but it the huge losses it’s taking on electric vehicles (EVs) continue to raise eyebrows.
What to Watch
Talking technicals: On Thursday, the SPX spent some time above 4,600, a level that marked technical resistance going back 16 months. In early 2022, the SPX tested that point on rally attempts three times following the record high it set near 4,800 soon after the new year began. It failed each time and fell from there. The 4,600 level marks the last resistance below the all-time high, says Nathan Peterson, director of derivatives analysis at the Schwab Center for Financial Research. The first step is registering a close above 4,600 and then monitoring for sustainability above that level in the following days for confirmation.
If Thursday’s sharp retreat is evidence, 4,600 still represents a challenging point for the SPX. It will continue to be an important level to watch on any rally.
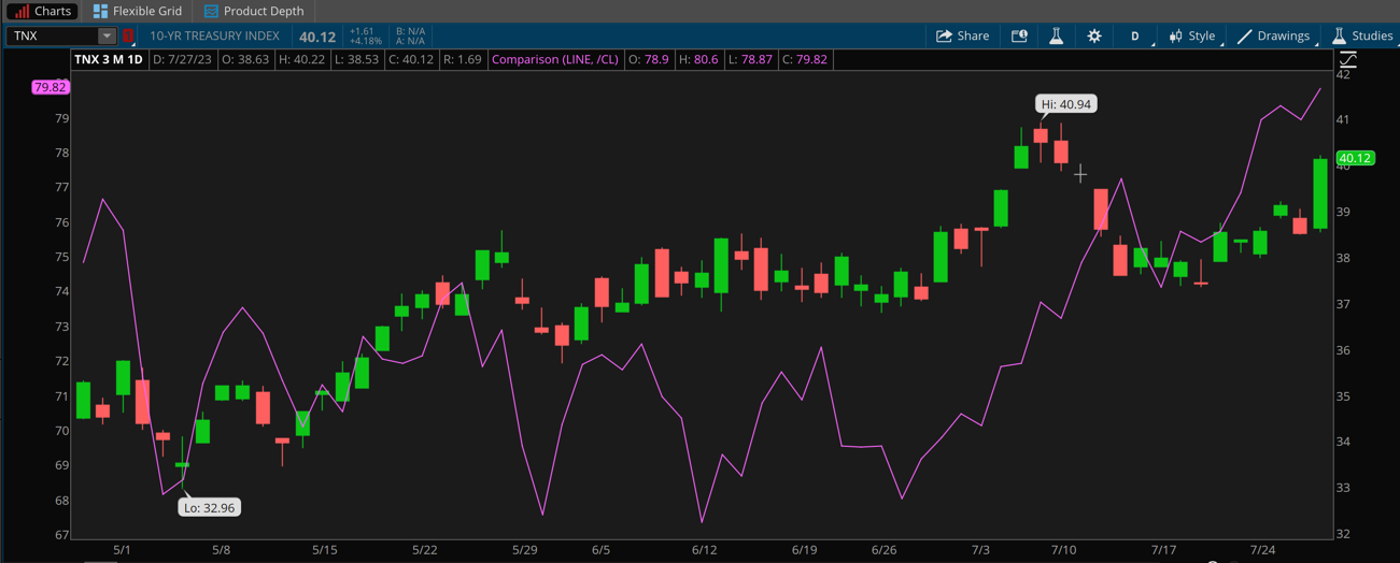
CHART OF THE DAY: BIRDS OF A FEATHER. Rising Treasury yields (TNX—candlesticks) often push crude oil futures (/CL-purple line) lower. That hasn’t been the case this month, as low supplies of crude supported that market and raised concerns about inflation, which in turn may have helped push Treasury yields higher. Chart source: The thinkorswim® platform from TD Ameritrade. For illustrative purposes only. Past performance does not guarantee future results.
Thinking cap
Ideas to mull as you trade or invest
Rabbit, meet hat: Less impressive revenue growth for S&P 500 companies reporting to date partially reflects easing inflation and its impact on pricing power. With that in mind, how did more than 80% of S&P 500 companies reporting through mid-week beat analysts’ bottom-line estimates? First, analysts set a low bar for earnings results, making estimates easier to beat. The average earnings per share (EPS) estimate is -9% for S&P 500 companies on a year-over-year basis, FactSet says. Better-than-expected EPS could also reflect cost-cutting many companies took earlier this year, as seen yesterday with Intel.
Margin call: The margin pressure we noted yesterday isn’t across the board. Some sectors are doing well on that front, including industrials, consumer discretionary, and real estate. Sectors accounting for much of the margin pressure include energy, materials, and health care, FactSet notes. Lower crude oil and natural gas prices versus a year ago likely took a big bite out of energy’s profit margins, for instance. Many analysts think Q2 might represent the margin trough, and that’s one factor behind estimates for stronger earnings growth in the second half.
Inflation fears fueled: One price metric the Fed and other central banks have little control over is commodities, and the recent three-month high in front-month CME crude oil futures (/CL) has fueled worries. There’s certainly a chance that despite central banks’ best-laid plans, the price of crude—a product that permeates nearly every aspect of the global economy—could keep inflation elevated. One argument against that is a futures market that’s in backwardation, meaning contracts farther out are lower than the current price. This is partly seasonal, as crude prices typically peak in the Northern Hemisphere’s summer and U.S. “driving season” only has about a month left. While spot crude prices of $80 per barrel might fuel inflation concerns, a futures market that prices in $76 by early next year suggests less reason to worry. Also, the recent production cuts by Saudi Arabia mean more crude is being left in the ground every month, which potentially could mean an extra supply cushion. Strong demand, however, is keeping prices elevated.
Calendar
July 31: July Chicago PMI and expected earnings from CNA Financial (CNA) and Tenet Healthcare (THC)
Aug. 1: July ISM Manufacturing Index and June Job Openings, and expected earnings from Altria (MO), Caterpillar (CAT), Illinois Tool (ITW), Advanced Micro Devices (AMD), Merck (MRK), Pfizer (PFE), Uber (UBER), Allstate (ALL), and Starbucks (SBUX)
Aug. 2: ADP Employment Change, and expected earnings from DuPont (DD), Kraft Heinz (KHC), Yum Brands (YUM), Clorox (CLX), PayPal (PYPL), and Shopify (SHOP)
Aug. 3: June Factory Orders, July ISM Non-Manufacturing Index, and expected earnings from Amazon (AMZN), Apple (AAPL), Coinbase (COIN), Amgen (AMGN), Alibaba (BABA), Hyatt Hotels (H), and Kellogg (K)
Aug. 4: July Nonfarm Payrolls and expected earnings from Dominion Energy (D), Enbridge (ENB), and Corebridge Financial (CRBG)
TD Ameritrade® commentary for educational purposes only. Member SIPC.
Image sourced from Shutterstock
This post contains sponsored content. This content is for informational purposes only and not intended to be investing advice.
© 2024 Benzinga.com. Benzinga does not provide investment advice. All rights reserved.
Trade confidently with insights and alerts from analyst ratings, free reports and breaking news that affects the stocks you care about.

