


(Friday Market Open) Caution stormed back into the markets this week after a tropical January vacation.
Things went south for stocks in a hurry the last two days, while risk signals like bond yields and volatility rose sharply. Investors now seem to have a basket of worries to ponder—weak earnings, rate uncertainty, tension with China and now rising crude oil prices following Russia’s plan to cut production 500,000 barrels a day. There’s no one specific catalyst driving things lower.
The Cboe Volatility Index® (VIX) climbed from recent lows below 19 to well above 21 by early Friday. Elevated volatility and associated market choppiness could continue ahead of the January Consumer Price Index (CPI), due Tuesday before the open.
Recent stock market weakness led to some “buy the dip” action. It’ll be interesting to see if that’s the case today with more Fed speakers on tap later on and next Tuesday’s CPI report dead ahead.
Technical support for the S&P 500® index (SPX) appears to be near 4,075 to 4,080, and below that near 4,050.
Morning rush
- The 10-year Treasury yield (TNX) climbed to above 3.7%.
- The U.S. Dollar Index ($DXY) is up slightly at 103.5.
- Cboe Volatility Index® (VIX) jumped sharply to 21.86, its highest level in more than a month.
- WTI Crude Oil (/CL) rose to $79.50 per barrel.
The January rally stirred 2019 nostalgia. This week has felt a bit more like 2022, and it’s doubtful anyone’s nostalgic for that. As we saw last year, stubborn strength in Treasury yields and the dollar tend to push stocks down.
Those factors could help explain why things went from green to red yesterday, Thursday’s early stock rally coincided with drops below 3.6% in the 10-year Treasury yield and 103 in the $DXY. Robust demand at a government 10-year note auction Wednesday may have pressured yields and, at least for a while, opened the way for stocks to move higher.
Later Thursday, stocks slumped when yields and the dollar retested recent highs. By this morning, the 10-year yield breached 3.7% and the dollar was well above 103, versus below 101 earlier this month. You might recall the 3.7% level puts the 10-year yield near a downtrending line on the charts, raising worries that this pounce above 3.7% might bring more technical selling and send yields even higher.
This morning’s yield and dollar strength suggest that economic caution hasn’t vanished, especially in the wake of so much hawkish Fed talk this week. Also, influential JPMorgan Chase (JPM) CEO Jamie Dimon told Reuters Thursday that it’s too early to declare victory over inflation.
Data docket
Today’s key report is the initial February University of Michigan Consumer Sentiment Index, due soon after the open. Analysts expect a headline reading of 65.0, according to consensus from Briefing.com. That’s up slightly from 59.7 in December and 64.9 in January.
The report also will show consumer expectations for one-year inflation. This metric eased from 4.4% in December to 3.9% last month.
Next week: Highlights include Tuesday morning’s January CPI report, as well as expected earnings the following day from Cisco (CSCO) and Friday from Deere (DE). Wednesday’s January Retail Sales data also could have market ramifications. A disappointing December reading slammed stocks.
January Housing Starts and Building Permits and January Producer Prices (PPI) later in the week make it a packed period on the calendar. Choppiness could intensify as the numbers roll in.
Value Check
The SPX sure had its ups and downs this week, and valuation concerns may be one reason rallies can’t seem to hold their ground. The SPX entered the week with a price-earnings (P/E) above 18, up from 17 at the start of the year and above the 10-year average.
Briefing.com noted Thursday that any move toward the 4,200 level and a 19 P/E could reinforce thinking that the index is overextended, making further gains challenging. This could help explain why 4,150 seems like such a tough level to surpass. A move above that early yesterday was met with heavy selling. Volume was lower than average yesterday on the New York Stock Exchange (NYSE), suggesting a lack of conviction, but Nasdaq Composite® volume exceeded normal levels.
Breadth is a big thing people look for in assessing a rally’s staying power. A rally that includes most S&P sectors, as we saw in January, is often thought to have more conviction than one carried by an influential sector or two. A couple parts of the market, including communication services and utilities, now appear to be holding this rally back.
Earnings Wrap
Results from Lyft (LYFT) late Thursday set an uncertain picture for the ridesharing company on Friday with shares down more than 30% in premarket trading. The company missed Wall Street’s consensus earnings per share (EPS) estimate and its forecast also came up short.
The news was better over at PayPal (PYPL) but shares only edged up a smidgen early Friday.
Reviewing the market minutes
Remember what we said yesterday about the coming market news vacuum potentially leading to choppy trading and volatility? That’s exactly what happened Thursday as the major indexes quickly lost their grip on early rallies and ended up closing at one-week lows. Choppiness could continue from here.
While there was decent buying interest early Thursday when the SPX dipped below 4,100, it didn’t really show up when the index fell back below that level later in the day. This might reflect lack of investor willingness to jump in ahead of Tuesday’s CPI data.
Another source of grief could be rising tensions between the United States and China. Geopolitics might grab more headlines in coming weeks because there’s a lighter earnings schedule and no Federal Reserve meetings anytime soon. Less market news tends to shift focus to geopolitical developments.
Speaking of the Fed, that’s also causing choppiness. After this week’s mix of hawkish and dovish remarks from Fed Chairman Jerome Powell and additional hawkishness from most other Fed speakers, investors don’t seem to be sure where the Fed’s at. This makes it harder to predict how the market might react to upcoming data.
Communication services took a major blow Thursday as mega-caps Alphabet (GOOGL) and Meta Platforms (META) continued to decline. All of GOOGL’s gains since late January are now erased. Could this contagion spread across info tech? Apple (AAPL) and Microsoft (MSFT) remain well above late-January levels but watch for any possible pressure on these two market beacons. Next week’s expected earnings from tech benchmark CSCO could offer another check into sector health.
Here’s how the major indexes performed Thursday:
- The Dow Jones Industrial Average® ($DJI) fell 249 points, or 0.73%, to 33,699.
- The Nasdaq Composite ($COMP) slipped 1.02% to 11,789.
- The Russell 2000® (RUT) fell 1.4% to 1,915.
- The SPX fell 36 points, or 0.88%, to 4,081.
Weekly wrap: Looking for a takeaway from this week so far? It might be that the economy is thriving but the Fed isn’t ready to let go. That’s the word from Schwab’s Chief Fixed Income Strategist Kathy Jones. Watch the video for more insight.
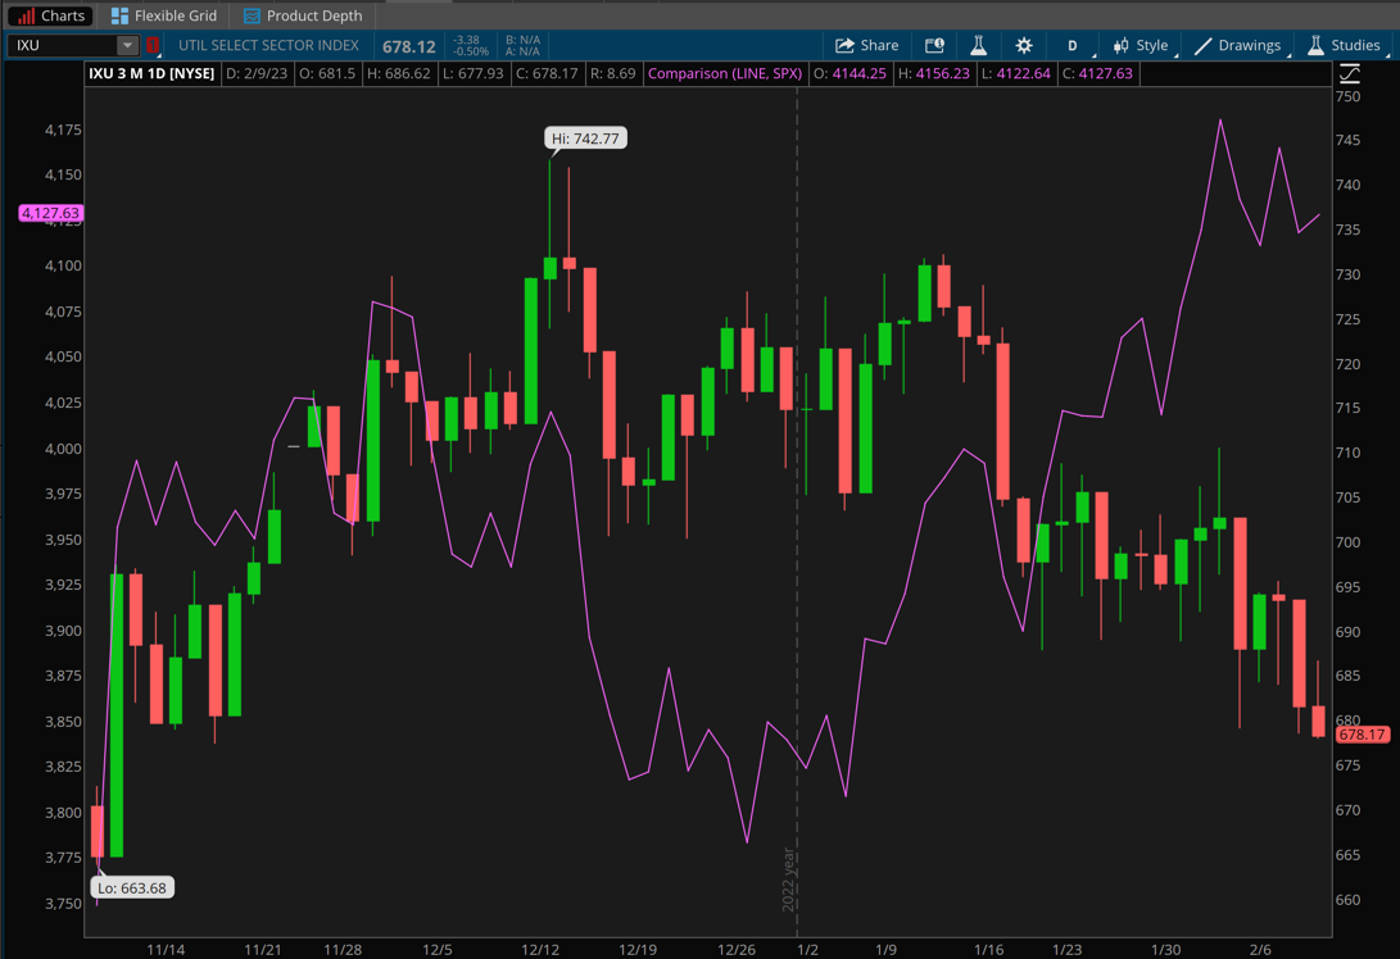
CHART OF THE DAY: POWER OUTAGE. The normally low-profile S&P Utilities Select Index ($IXU—candlesticks) had a moment in the sun late last year as investors snapped up shares of utilities firms amid a sharp fall in bond yields. With investors moving back toward growth sectors and yields now bouncing off lows, the S&P 500 index (SPX—purple line) has easily outperformed utilities so far this year. The IXU is down nearly 5% since the end of December, making it the worst-performing sector of 2023. Data source: S&P Dow Jones Indices. Chart source: The thinkorswim® platform. For illustrative purposes only. Past performance does not guarantee future results.
Three Things to Watch
Captain video: This week twice demonstrated how market-moving news can happen in real time. First, GOOGL’s artificial intelligence (AI) technology delivered the wrong answer in a company presentation, raising questions about the product and helping send GOOGL shares down sharply. Double whammy—MSFT was announcing its own AI advances right about the same time. The second made-for-video moment came Thursday morning on CNBC just before the open. The network had just finished interviewing Walt Disney (DIS) CEO Bob Iger, an interview that included questions about a proxy fight led by DIS investor Nelson Peltz. Viewers got a big surprise just minutes after Iger’s segment when Peltz himself called into the network to declare victory in the proxy fight, saying it was over. DIS stock, already up on solid earnings, gave back gains after the Peltz call but was already up sharply since Iger’s return to the company last year.
Falling thermostat: The utilities sector sometimes operates under the radar, though market wisdom suggests it has merits as a sector with high dividends and very little exposure to international headwinds. After a sizzling 20% rise between mid-October and mid-December, the S&P Utilities Select Index ($IXU) is struggling a bit this week and really since the new year (see chart above). A lot of this has to do with Treasury yields. Utilities often perform better when Treasury yields are low because many utilities firms are considered bond market “proxies,” competing with the bond market by offering high dividend yields. The dividend yield for the utilities sector was recently near 3.8%, a level that 10-year Treasury yields aren’t too far below. When Treasuries offer competitive yields, utilities often lose steam as investors seek yield in a “safer” package. No investment is truly “safe,” of course.
Getting Technical on Oil: Earlier this week, we mentioned a downtrending line in WTI Crude (/CL) that extended from peaks of last fall and now stands just above the market at around $80 per barrel, not far below the 100-day moving average. Despite a quick rally from $73 to $78 this week—reflecting China demand hopes and supply disruptions caused by the earthquake in Turkey—the front-month /CL contract didn’t really challenge the technical resistance represented by that line. A push above that might open up a test of the 200-day moving average near $91, which also represents the early November peak. Support seems quite firm in the $70 to $73 range, which front-month futures bounced off several times recently. They’ve been between $70 and $80 for two months without really carving any obvious charting pattern indicating potential upside or downside.
Notable calendar items
Feb. 13: No major earnings or data of note
Feb. 14: January Consumer Price Index (CPI) and expected earnings from Coca-Cola (KO) and Marriott (MAR)
Feb. 15: January Retail Sales, January Capacity Utilization and Industrial Production, and expected earnings from Biogen (BIIB) and Kraft Heinz (KHC)
Feb. 16: January Housing Starts and Building Permits, January Producer Price Index (PPI), and expected earnings from Entergy (ETR), Hasbro (HAS), and Hyatt Hotels (H)
Feb. 17: January Import and Export Prices, January Leading Indicators, and expected earnings from Deere (DE)
Feb. 20: President’s Day – market holiday
Feb. 21: January Existing Home Sales and expected earnings from Home Depot (HD) and Medtronic (MDT)
TD Ameritrade® commentary for educational purposes only. Member SIPC.
Image sourced from Shutterstock
This post contains sponsored advertising content. This content is for informational purposes only and not intended to be investing advice.
© 2024 Benzinga.com. Benzinga does not provide investment advice. All rights reserved.
Trade confidently with insights and alerts from analyst ratings, free reports and breaking news that affects the stocks you care about.

