


(Thursday Market Open) One day ahead of December’s big jobs report, stocks turned lower on stubbornly hot hiring data and continued indications the Fed will stay tough on rates.
Before the open, ADP released more strong hiring news in its December private payrolls report, which rose 235,000 for the final month of 2022, and well above estimates around 150,000. It’s one more hot jobs number ahead of tomorrow’s Nonfarm Payrolls report, and not likely what the Fed wants to hear.
ADP reported gains in service jobs, led again by leisure and hospitality, followed by professional and business services and education and health services. However, trade, transportation, and utilities led the largest group of job losses by industry. With tomorrow’s December jobs data, investors will definitely want to watch what the government says about industry segments that are continuing to hire and the latest wage data contained in the report—higher pay generally leads to higher inflation.
Moments later, Initial Jobless Claims for the week ended December 31 took another slide to 204,000 from the previous week’s 223,000 and well below market expectations of 225,000.
Treasury yields popped back up immediately after that to 3.765%. This still-hot hiring data is a sign that the Fed probably has more work to do. Retiring Kansas City Fed President Esther George, told CNBC early this morning that she now projects interest rates going above 5% “for some time” before the central bank sees signs inflation is truly starting to weaken.
Stay tuned for two more Fed speakers later in the day—the Atlanta Fed’s Raphael Bostic and the often-hawkish St. Louis Fed chief James Bullard, both scheduled for appearances.
Meanwhile, earnings season got an early start this morning with above-expectations earnings and below-expectations revenue results from Walgreens Boots Alliance WBA. Shares were down 2.27% premarket, though the global drug chain raised its full-year revenue outlook due partially to its recent acquisition of Summit Health. The retailer also said an early flu season boosted sales of flu and cold medications.
After news reports Wednesday night that Amazon AMZN will lay off more than 18,000 workers and continue cuts into 2023, shares were up 1.30% before the open. Last fall, reports estimated the firm would cut 10,000. The news follows Wednesday’s announcement from Salesforce CRM that it would 10% of its payroll.
Finally, watch the S&P 500® index (SPX)—3,819 and 3,800 look like possible support levels.
Morning Rush
- The 10-year Treasury yield (TNX) was unchanged this morning at 3.7%.
- The U.S. Dollar Index ($DXY) moved up 0.34%
- Cboe Volatility Index® (VIX) was nearly unchanged
- WTI Crude Oil (/CL) recovered almost 2% to $74.27 per barrel.
Yesterday afternoon’s release of the December Federal Reserve meeting minutes caused some concern in the stock market, but after a half hour or so, market participants appeared to shake off the Fed’s hawkish tone and pushed major indexes higher to close the session.
Neither the VIX nor Treasuries really showed much reaction to the Fed minutes either, with the VIX steadily falling in the final hour to end the day just above 22 after making a run toward nearly 24 early on. It maintained that that level before Thursday’s open.
The relatively low VIX levels tend to imply fewer hills and valleys in daily stock trading, and that’s definitely been the case lately. SPX hasn’t had a daily up or down move of 2% or more since December 15, right after the VIX leaped above 25. The VIX hasn’t visited that realm since (see chart below).
Numbers to Know
210,000 and 0.4%: These are Wall Street consensus expectations for tomorrow’s December Nonfarm Payrolls monthly jobs and wage growth, according to Briefing.com. Unemployment is expected to be flat at 3.7%. If the numbers come in this way, they likely won’t move the needle much as far as the Fed’s concerned because these are still historically strong levels, and the Fed wants to see jobs and wage growth slow down to keep inflation at bay.
-2.8: This is the year-over-year Q4 S&P 500 earnings decline anticipated by Wall Street analysts, according to FactSet. That’s down from the September 30 estimate for 3.7% growth. The final 2022 quarter had been forecast for decent progress, but now it looks like it might be the first to post an earnings decline since Q3 2020. FactSet is expected to provide its first updated earnings estimate of the year by the end of the week.
-7.3%: Here’s a sign from FactSet that the Q4 earnings picture is actually worse than it looks. After stripping out energy, which had a great 2022 thanks to high crude oil and natural gas prices, the final 2022 quarter looks downright depressing at –7.3%. As for which broad market sectors are expected to do worse in Q4, the research firm points to materials, consumer discretionary, info tech, and communications services. Energy and industrials are anticipated to improve year over year.
For the waterfront on what’s likely ahead for Q4 results, take a look at The Ticker Tape’s Q4 Earnings Outlook.
Data Department
If you know people looking for work, times are still good—likely too good, especially if you’re a Fed policymaker. U.S. job openings stayed strong in November.
Wednesday’s Job Openings and Labor Turnover Survey (JOLTS) revealed November’s open job positions at 10.46 million, just a slight decrease from October’s levels but well above the 10-million-openings consensus. JOLTS is one of those Fed-favorite indicators watched closely for signals of economic expansion or contraction, and the latest numbers were likely the opposite of what the central bank wanted to see in its lengthening inflation fight. Softening wages can often demand that prices soften as well.
Quits—a key JOLTS measure of how confident workers feel that they can land a job once they leave their current employer—also wasn’t great news for the Fed. Though there was a slight decrease in hiring for November, quits rose by 126,000, up one-tenth of a percentage point with open jobs now outnumbering available workers by roughly 1.7 to 1.
Yet, one key employment area—manufacturing—retrenched for the second month in a row after 29 months of growth. In December, the Institute of Supply Management (ISM) Manufacturing Purchasing Managers Index (PMI) came in nearly at a consensus of 48.4%. All readings under 50% signal contraction, and the survey noted that the new level represents a 0.1% “decrease in real domestic product on an annualized basis.” It was also the steepest decrease since the start of the global COVID-19 pandemic.
While overall hiring in the factory industry remained strong, the report noted that job creation was tilting more toward skilled hires by the end of 2022. Also, the prices paid component of the ISM data hit its lowest level since April 20, likely a positive sign on the inflation front.
U.S. automakers, facing the perfect storm of rising inflation and continued vehicle shortages due to lingering supply chain snarls, turned in their worst sales numbers since 2011 yesterday. The Wall Street Journal reported that U.S. auto sales industrywide stood at 13.7 million vehicles last year, down 8%. The numbers featured one notable reversal—General Motors GM pulled ahead of Toyota Motor Corp. TM in U.S. auto sales after the Japanese automaker briefly took the No. 1 slot in 2021.
With automobiles dependent on global semiconductor supplies to finish production, Asian carmakers have been particularly hard-hit since the supply chain disruptions that began in 2020.
Reviewing the Market Minutes
For the first time since December 21, the SPX managed to close above 3,850 on Wednesday, ending a gloomy stretch of seven trading days in a row in which the daily settlements hardly varied in a narrow range below that level. Still, not a lot of progress was made. The SPX had a so-called “inside day” on the charts, meaning its Wednesday high and Wednesday low were both within Tuesday’s price range. That could suggest there’s not a lot of conviction here at the start of the year.
One thing that could keep things on simmer today is the elephant in the room called the December Nonfarm Payrolls report, due before the open Friday. Some Chicago floor traders used to call the week leading up to the report, “unenjoyment week,” a reference to how the market seldom makes any interesting moves as investors prepare for key data on unemployment, wages, and jobs creation. Perhaps Friday can be a more exciting day, though there’s no guarantee it’ll bring “enjoyment” for anyone in the markets.
Energy companies, which led all sectors last year, are off to a rough start in 2023 as crude oil prices tanked to begin the week. At the same time, some sector laggards of 2022 like communication services, info tech, and financials have come out of the gate strong.
Here’s how the major indexes performed Wednesday:
- The Dow Jones Industrial Average® ($DJI) gained 133 points, or 0.4%, to close at 33,269.
- The Nasdaq Composite®($COMP) rose 0.69% to 10,458.
- The Russell 2000® (RUT) climbed 1.25% to 1,772.
- The SPX added 28 points, or 0.75%, to close at 3,852.
Talking Technicals: For those who believe in Santa (or in this case, the “Santa Claus rally”), the stockings are now full. Traditionally, the Santa Claus rally encompasses the last five trading days of December and the first two of January. To have a successful Santa stretch this year, the SPX needed to close above 3,822 on Wednesday. It cleared that barrier by about 30 points. Meaningful? Not necessarily, but it did keep alive a stretch of Santa Claus rallies going back to 2016. We had one last year, so that should tell you all you need to know about whether it ultimately leads to a naughty or nice year.
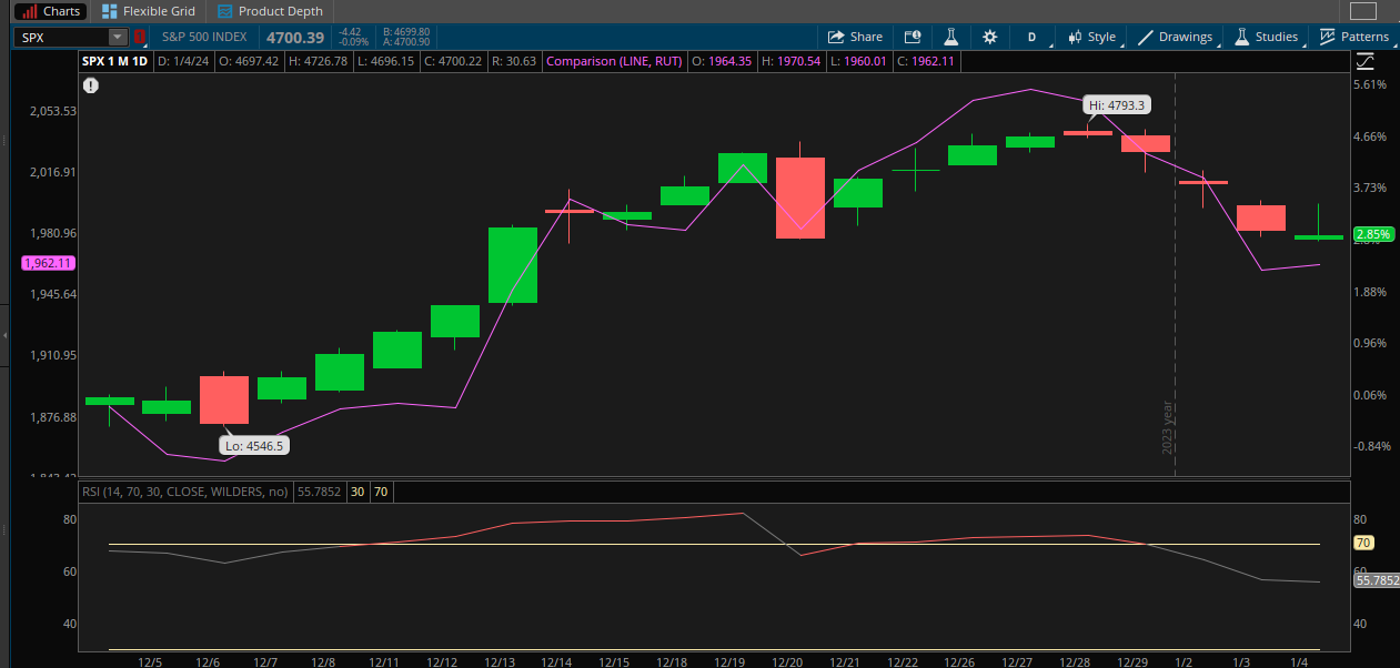
CHART OF THE DAY: LOWER VIX, LESS CHOP. Over the last month, the Cboe Volatility Index (VIX—candlesticks) has really leveled off from its summer and fall highs, settling into a long stretch between 20 and 25 near the historic average. The S&P 500 index (SPX—purple line) became less volatile as the VIX marched in place, with no major daily moves since mid-December. That goes along with standard statistical models implying that with the VIX at these levels, the expected daily range for the SPX would be 1% to 1.5% about two-thirds of the time. Data sources: Cboe, S&P Dow Jones Indexes. Chart source: The thinkorswim® platform. For illustrative purposes only. Past performance does not guarantee future results.
Three Things to Watch
How Long Can the Yield Pullback Last? Treasury yields fell sharply early this week as investors appeared to take more of a risk-off approach amid tech stock downgrades, layoffs, and China’s COVID-19 worries. The TNX dipped below 3.7% Wednesday for the first time since December 23, off 20 basis points from last week’s 3.9% peak. Still, the yield remains well above December’s 3.4% low and might see a challenge getting back to that level right away.
What’s propping up yields? Well, the Fed for one thing, as it began the year with a hawkish note from Minneapolis Fed President Neel Kashkari saying he favors raising the Fed’s target rate to 5.4%. Also, despite rising caseloads, China’s reopening has been seen as possibly bearish for Treasuries (which fall when yields rise). Another factor—the U.S. economy is still perhaps the nicest-looking house on a bad block. In other words, investors may worry about recession here, but they worry more about weakness in Europe and Asia. That could mean more money headed into U.S. bonds, often seen as a safe haven, though no investment is truly “safe.” Where could the TNX face a test on the charts? Possibly near 3.6%, which has represented both support and resistance over the last month.
What’s Up? Yield Inversion: This week’s steep decline in TNX wasn’t accompanied by similar action in shorter-dated Treasuries like the 3-month or 2-year yields. This has caused the gap between the 2-year and 10-year yields to invert even further, climbing back above 60 basis points to nearly all-time highs. Typically, this kind of yield inversion is seen as bearish for the economy, implying that investors are taking a risk-off approach that embraces long-term investments in Treasuries over shorter-term opportunities. This setup tends to hurt the financials sector’s earnings by pushing down their profit margins on long-term loans. Keep an eye on the 2-year Treasury yield, which is among the most sensitive to Fed policy. At the current 4.36%, it’s still well below the Fed’s terminal, or peak, target funds rate of between 5% and 5.25%. Further yield inversion could be ahead if market participants start taking Fed officials like Kashkari at their word.
Curb Your Expectations: The new year is usually a time for optimism. However, if the Fed keeps pumping the brakes and the U.S. and other economies continue to struggle, don’t get your hopes too high for the long-term stock market outlook. A Charles Schwab report this week titled “Schwab’s 2023 Long-Term Capital Market Expectations suggests that investors prepare for possible leaner times.
“Over the next decade, we continue to expect market returns to fall short of long-term historical averages,” the report said. “Compared to last year’s expectations, our outlook highlights better opportunities for bonds, driven primarily by higher starting yields. While expected stock returns were helped by more attractive starting valuations…due to stock market declines during 2022, they were also hurt by company-level and macroeconomic headwinds, leading to slower-than-expected earnings growth. The net result may be a similar return outlook for stocks. As such, Schwab continues to project better return opportunities for international stocks over the next 10 years, relative to domestic stocks.”Notable Calendar Items
Jan. 6: December Nonfarm Payrolls, November Factory Orders, and December ISM Non-Manufacturing Index
Jan. 9: November Consumer Credit
Jan. 10: November Wholesale Inventories and expected earnings from Albertson’s (ACI)
Jan. 11: Expected earnings from KB Home (KBH)
Jan. 12: December Consumer Price Index (CPI) and expected earnings from Delta (DAL) and Taiwan Semiconductor (TSM)
Jan. 13: January University of Michigan Consumer Sentiment and expected earnings from JP Morgan (JPM), Bank of America (BAC), Citigroup (C), and Wells Fargo (WFC)
Jan: 16: Dr. Martin Luther King, Jr.’s birthday observance. Markets closed.
Jan. 17: January Empire State Manufacturing and expected earnings from Goldman Sachs (GS) and Morgan Stanley (MS)
Image sourced from Shutterstock
This post contains sponsored advertising content. This content is for informational purposes only and not intended to be investing advice.
© 2024 Benzinga.com. Benzinga does not provide investment advice. All rights reserved.
Trade confidently with insights and alerts from analyst ratings, free reports and breaking news that affects the stocks you care about.

