


(Monday Market Open) Now that Friday’s bearish Producer Price Index (PPI) is in the rearview mirror, focus turns to tomorrow’s November Consumer Price Index (CPI) data and Wednesday’s Federal Reserve rate decision.
Don’t be surprised if trading is sluggish Monday; market participants might not be eager to take large new positions before so much intrigue. Volatility is picking up ahead of the news.
It’s not just U.S. inflation and central bank data that could move markets. There’s also a decent-sized batch of European inflation data coming out early Tuesday ahead of U.S. CPI, making it a fairly big day from an inflation standpoint. That’s followed later this week by meetings of the Bank of England (BoE) and the European Central Bank (ECB).
Another thing on Wall Street’s collective mind this morning is reopening in China. There’s fear that virus cases could spike, another potential driver of volatility. Before the open, the Cboe Volatility Index® (VIX) stood a little over 24.
While the hotter-than-expected PPI data isn’t likely to change what the Fed’s been telegraphing about a probable 50-basis-point rate hike, stronger inflation could lead to future discussions about a possible higher terminal, or peak, rate. The median Fed terminal rate was 4.6% back in September when it last made a projection. That’ll be updated Wednesday.
So will the Fed’s economic and rate projections. The rate projections will be scrutinized for clues about the path of rate hikes next year.
Morning Rush
- The 10-year Treasury yield (TNX) is down slightly at 3.54%.
- The U.S. Dollar Index ($DXY) is flat at 104.81.
- Cboe Volatility Index (VIX) futures popped above 24, the highest it’s been since mid-November.
- WTI Crude Oil (/CL) is up slightly at $71.61.
Keep an eye on VIX as we navigate the week. It’ll give you a good indication of how markets are digesting incoming data. However, volume might slow down dramatically next week after all the data and central bank meetings as we approach two holiday weeks.
Data Watch: CPI Looms
Last month’s CPI, if you’ll recall, caused stocks to spike and Treasury yields to dip when it came in much softer than analysts expected. The 10-year yield traded near 4.15% before the release of October’s CPI data. It’s at 3.59% now. That’s the kind of impact a softer inflation picture can have.
However, Friday’s November PPI report muddied the waters regarding the popular theory that inflation is eroding. PPI featured a 0.3% gain in headline wholesale inflation and a 0.4% rise in the core category versus Wall Street’s consensus of 0.2% for each. The year-over-year PPI moderated a bit to 7.4% from 8.1%, the lowest in more than a year. That said, the rise in month-over-month data caused uneasiness.
Whether PPI means anything for November CPI tomorrow is questionable. Sometimes it can take a few months for rising PPI to translate into higher CPI.
Consensus on Wall Street is for a 0.3% rise in both headline and core CPI (the core data strips out volatile food and energy prices). The figures were 0.4% and 0.3% in October, respectively.
If the numbers exceed those relatively high expectations, equities, commodities, and rates markets may see volatility.
Fed Prepares to Meet
By now, it may be too late for the Fed to steer away from a 50-point hike even if the CPI data is a lot worse (higher) than expected. At the end of last week, the market built in a 23% chance of the Fed raising rates 75 points, perhaps accounting for the possibility of a hot CPI number. That was up only a few ticks from 20% before the PPI report.
- The rate hike is likely the easiest thing to predict about this week’s Federal Open Market Committee (FOMC) meeting. There’s also the FOMC’s updated “dot-plot,” which shows where officials think rates will be over the next three years. Investors should compare the updated dots to September’s.
- The riddle is where the FOMC will land on its terminal, or peak, rate projection. Back in September, the FOMC pegged the 2023 terminal rate at a median of 4.6%. Judging from the futures market and from many Fed members’ recent speeches, that level is too low and needs to go up. But to where?
- As of late Friday, the CME FedWatch Tool showed about a 46% chance that the Fed will raise rates to 5% or more by next summer from the current range of 3.75% to 4%.
- The tool also showed a less than 10% chance of rates staying above 5% a year from now—meaning the market predicts a pullback late next year. However, if tomorrow’s CPI data is hot following the bearish PPI, people may start to revise their views on the Fed’s impending decision.
- One viewpoint is the Fed won’t necessarily raise rates much above 5% but will keep rates there longer to make sure inflation is truly tamed before giving the economy some relief. The Fed may be haunted by a mistake it made back in the early 1980s when it lowered rates only to see inflation gallop higher again. The Fed ultimately had to hike again, hurting both the economy and the Fed’s credibility.
- There’s growing concern that the Fed, in its eagerness to suffocate inflation, might hike the economy into a recession. The recent weak performance of bank stocks and the strong performance of “counter-cyclical” sectors like utilities, health care, and consumer staples is a sign that the stock market has begun to register this, research firm Briefing.com said in a note Friday. The inverted Treasury yield curve offers additional evidence (see more below).
The positive thing is that all this tightening has made yields more attractive for investors. This includes yields for municipal bonds, despite 2022 being a brutal year for the muni market. Muni yields are near their highest level in over a decade, according to Charles Schwab research.
Potential Market Movers
The major news after the closing bell is courtesy of computer technology company Oracle ORCL, which is expected to report earnings this afternoon.
Even if your portfolio doesn’t include Oracle, the company is worth watching because its finger is on the pulse of much of the global economy. It also offers another glimpse at cloud computing, which took a beating during the most recent earnings season. Cloud growth for Amazon AMZN and Salesforce CRM disappointed many investors, leading to concern that a slowing economy worldwide may be hurting business investment in cloud technology. What will ORCL have to say about that?
When Oracle last reported in September, its revenue surpassed Wall Street’s estimates, but it missed earnings per share (EPS), partly due to U.S. dollar strength. The dollar remains elevated but fell the last few weeks, possibly offering a tailwind for future EPS.
ORCL’s cloud revenue for its first fiscal quarter rose by a solid 45%, and its forecast for November included cloud revenues up between 46% and 50%, adjusted for currency.
Reviewing the Market Minutes
After a resilient performance through most of Friday’s session, stocks ultimately belly flopped late in the day. The S&P 500® index (SPX) ended down Friday for the sixth of seven sessions, falling more than 3% from a week ago. The Nasdaq Composite®($COMP) dropped nearly 4%, and the Russell 2000®(RUT) fell 5%.
Technically, the SPX held its own, staying within the 3,920-3,940 range that’s been a support level on the charts since mid-November. Still, last week’s underperformance of mega-cap stocks like Apple AAPL, Microsoft MSFT, and Alphabet GOOGL weighed on the major indexes. Bank stocks like JPMorgan Chase JPM and Goldman Sachs GS also got kicked around last week, and the old market saying is that it’s hard to have a rally without bank participation.
Here’s how the major indexes performed Friday:
- The Dow Jones Industrial Average® ($DJI) fell 305 points, or 0.9%, to 33,476.
- The $COMP dropped 0.7% to 11,004.
- The RUT gave up 1.19% to 1,796.
- The SPX retreated 0.73% to 3,934.
Talking Technicals: WTI Crude (/CL) traded in a pretty wide range Friday, scraping $70 per barrel at its low and almost touching $73 at its high. /CL remains in a downtrend on the charts, and $70 per barrel marks roughly the midpoint of the downward channel. A drop below $70 could set up more selling and a test of the lower trendline just below $65 per barrel. That lower trendline runs through the lows from July to September.
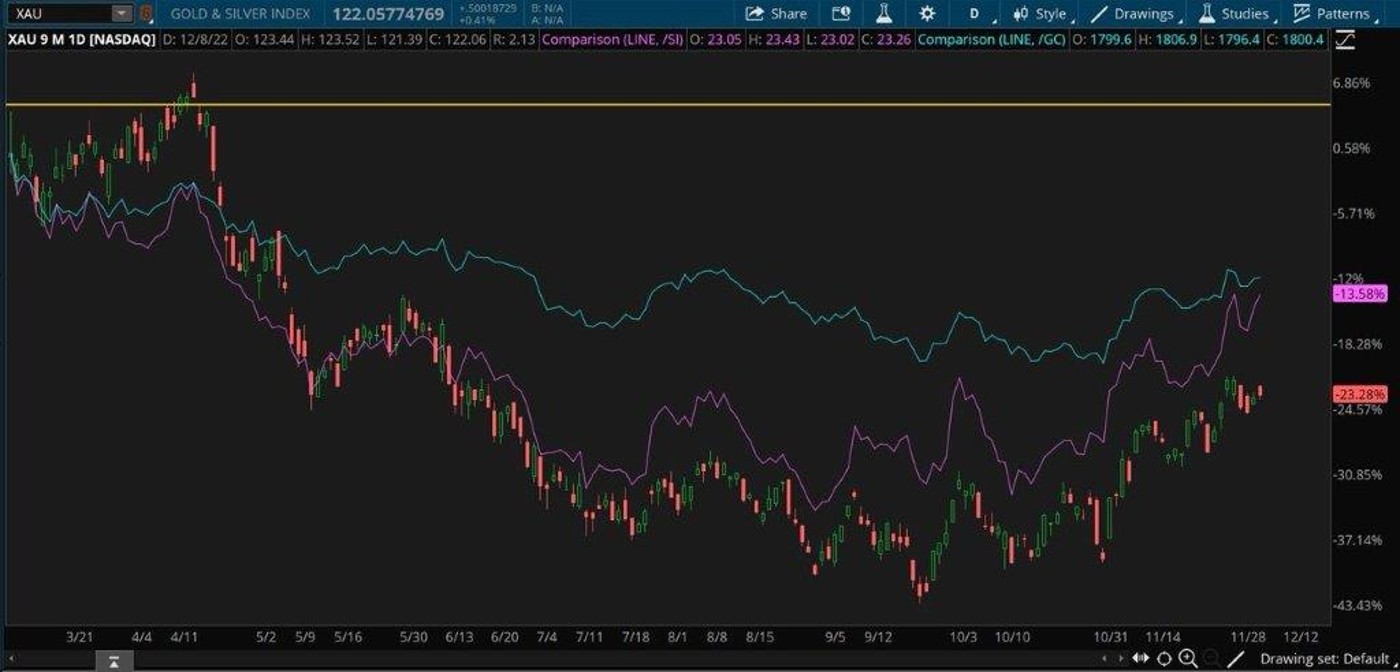
CHART OF THE DAY: YOU’VE GOT THE SILVER (AND GOLD). Investors appear to be thinking about more than just silver and gold decorations this holiday season. They’re thinking about those stocks as well. The Philadelphia Gold & Silver Index (XAU—candlesticks) started trending higher after reaching a bottom back in October. Silver futures (/SI—pink line) led the rally in precious metal stocks, and gold futures (/GC—blue line) have recently turned higher as well. Precious metals may finally be acting as the inflation hedge investors have come to expect, or they may be a “safe haven” for investors worried about a potential recession next year. Data source: CME Group. Chart source: The thinkorswim® platform. For illustrative purposes only. Past performance does not guarantee future results.
Three Things to Watch
A Glimmer of Inflation Hope: Interestingly, Friday’s University of Michigan Consumer Sentiment Index data—which came in above analysts’ consensus—also showed consumers’ inflation expectations dropping to 4.6% for the next year, the lowest since September 2021. That’s only one number, but it might ease some worries among Fed officials who’ve expressed hope, to use Fed Chairman Jerome Powell’s words, that inflation expectations would remain “well anchored.” The concern among policymakers is that if inflation rises too much and for too long, consumers might expect it to keep running high, generating a vicious wage-price spiral like the kind that crippled the economy in the late 1970s.
Treasury Market Points to Struggles Ahead: While the consumer sentiment data offered hope about inflation, the Treasury market still points to heavy trudging ahead on that front. The interest rate sensitive 2-year Treasury yield recently traded near 4.3%, giving it a 75-basis-point premium to the 10-year Treasury yield (TNX), a situation known as yield curve inversion. These yields tell us the market expects rates to continue rising and potentially hurt the economy (yield curve inversions have often, but not always, preceded recessions).
Note that the 2-year yield is down only about 8% from its 2022 peak of 4.7%, which it reached on November 2, compared with a 12% drop for the 10-year yield from its level that day. This means the inversion has grown over the last month even as the stock market rose. It’s unclear exactly when or whether the inversion will narrow, but it’s fair to guess that will only happen when the market is convinced the Fed is ready to pause rate hikes.
Beyond CPI and the Fed: There’s more data due later this week if you’re still able to absorb it after all the fireworks on Tuesday and Wednesday. On Thursday, we’ll see November retail sales, the Empire State Manufacturing survey, and November Industrial Production and Capacity Utilization. These data will be closely watched for signs of economic retreat, especially after the Atlanta Fed lowered its GDPNow forecast for Q4 Gross Domestic Product (GDP) to 3.2% Friday from the previous 3.4%.
Notable Calendar Items
Dec. 13: November CPI, FOMC meeting begins, and expected earnings from ABM Industries (ABM)
Dec. 14: FOMC rate decision, quarterly projections and dot-plot, November Export and Import Prices, and expected earnings from Lennar (LEN)
Dec. 15: November Retail Sales, December Empire State Manufacturing, and November Industrial Production and Capacity Utilization
Dec. 16: Expected earnings from Accenture (ACN)
Dec. 19: No earnings or data of note
Dec. 20: November Housing Starts and Building Permits and expected earnings from General Mills (GIS) and Nike (NKE)
Dec. 21: November Existing Home Sales and expected earnings from Rite Aid (RAD) and Micron (MU)
TD Ameritrade® commentary for educational purposes only. Member SIPC.
Image sourced from Shutterstock
This post contains sponsored advertising content. This content is for informational purposes only and not intended to be investing advice.
© 2024 Benzinga.com. Benzinga does not provide investment advice. All rights reserved.
Trade confidently with insights and alerts from analyst ratings, free reports and breaking news that affects the stocks you care about.

