


In today's rapidly changing and highly competitive business world, it is vital for investors and industry enthusiasts to carefully assess companies. In this article, we will perform a comprehensive industry comparison, evaluating Eli Lilly and Co LLY against its key competitors in the Pharmaceuticals industry. By analyzing important financial metrics, market position, and growth prospects, we aim to provide valuable insights for investors and shed light on company's performance within the industry.
Eli Lilly and Co Background
Eli Lilly is a drug firm with a focus on neuroscience, cardiometabolic, cancer, and immunology. Lilly's key products include Verzenio for cancer; Mounjaro, Zepbound, Jardiance, Trulicity, Humalog, and Humulin for diabetes; and Taltz and Olumiant for immunology.
| Company | P/E | P/B | P/S | ROE | EBITDA (in billions) | Gross Profit (in billions) | Revenue Growth |
|---|---|---|---|---|---|---|---|
| Eli Lilly and Co | 132.43 | 67.79 | 20.33 | 19.91% | $3.03 | $7.57 | 28.1% |
| Novo Nordisk A/S | 46.11 | 35.95 | 16.62 | 22.01% | $28.51 | $55.85 | 36.95% |
| Johnson & Johnson | 29.33 | 5.34 | 4.59 | 5.78% | $6.82 | $14.6 | 7.3% |
| Merck & Co Inc | 911.86 | 8.60 | 5.41 | -3.11% | $-0.77 | $10.72 | 5.78% |
| AstraZeneca PLC | 35.35 | 5.33 | 4.59 | 2.52% | $2.18 | $9.72 | 7.29% |
| Novartis AG | 23.63 | 4.24 | 4.34 | 19.99% | $4.18 | $8.75 | 7.39% |
| Pfizer Inc | 72.03 | 1.70 | 2.57 | -3.62% | $-1.77 | $6.69 | -41.34% |
| Sanofi SA | 20.66 | 1.50 | 2.40 | -0.75% | $0.42 | $8.15 | 6.5% |
| Bristol-Myers Squibb Co | 13.32 | 3.54 | 2.37 | 6.03% | $4.45 | $8.73 | 0.62% |
| GSK PLC | 13.55 | 4.97 | 2.20 | 2.64% | $1.16 | $5.63 | 9.16% |
| Zoetis Inc | 32.65 | 15.17 | 8.96 | 10.42% | $0.83 | $1.49 | 8.48% |
| Takeda Pharmaceutical Co Ltd | 36.33 | 0.95 | 1.55 | 1.53% | $314.89 | $731.71 | 1.33% |
| Viatris Inc | 235.20 | 0.68 | 0.92 | -3.7% | $-0.07 | $1.6 | -1.0% |
| Dr Reddy's Laboratories Ltd | 19.39 | 3.78 | 3.73 | 5.29% | $22.42 | $42.2 | 6.57% |
| Jazz Pharmaceuticals PLC | 18.87 | 1.92 | 2.16 | 2.61% | $0.29 | $0.9 | 4.1% |
| Corcept Therapeutics Inc | 26.65 | 5.12 | 5.80 | 6.43% | $0.03 | $0.13 | 31.39% |
| Average | 102.33 | 6.59 | 4.55 | 4.94% | $25.57 | $60.46 | 6.03% |
By analyzing Eli Lilly and Co, we can infer the following trends:
-
The Price to Earnings ratio of 132.43 for this company is 1.29x above the industry average, indicating a premium valuation associated with the stock.
-
It could be trading at a premium in relation to its book value, as indicated by its Price to Book ratio of 67.79 which exceeds the industry average by 10.29x.
-
With a relatively high Price to Sales ratio of 20.33, which is 4.47x the industry average, the stock might be considered overvalued based on sales performance.
-
The company has a higher Return on Equity (ROE) of 19.91%, which is 14.97% above the industry average. This suggests efficient use of equity to generate profits and demonstrates profitability and growth potential.
-
Compared to its industry, the company has lower Earnings Before Interest, Taxes, Depreciation, and Amortization (EBITDA) of $3.03 Billion, which is 0.12x below the industry average, potentially indicating lower profitability or financial challenges.
-
The company has lower gross profit of $7.57 Billion, which indicates 0.13x below the industry average. This potentially indicates lower revenue after accounting for production costs.
-
The company's revenue growth of 28.1% is notably higher compared to the industry average of 6.03%, showcasing exceptional sales performance and strong demand for its products or services.
Debt To Equity Ratio

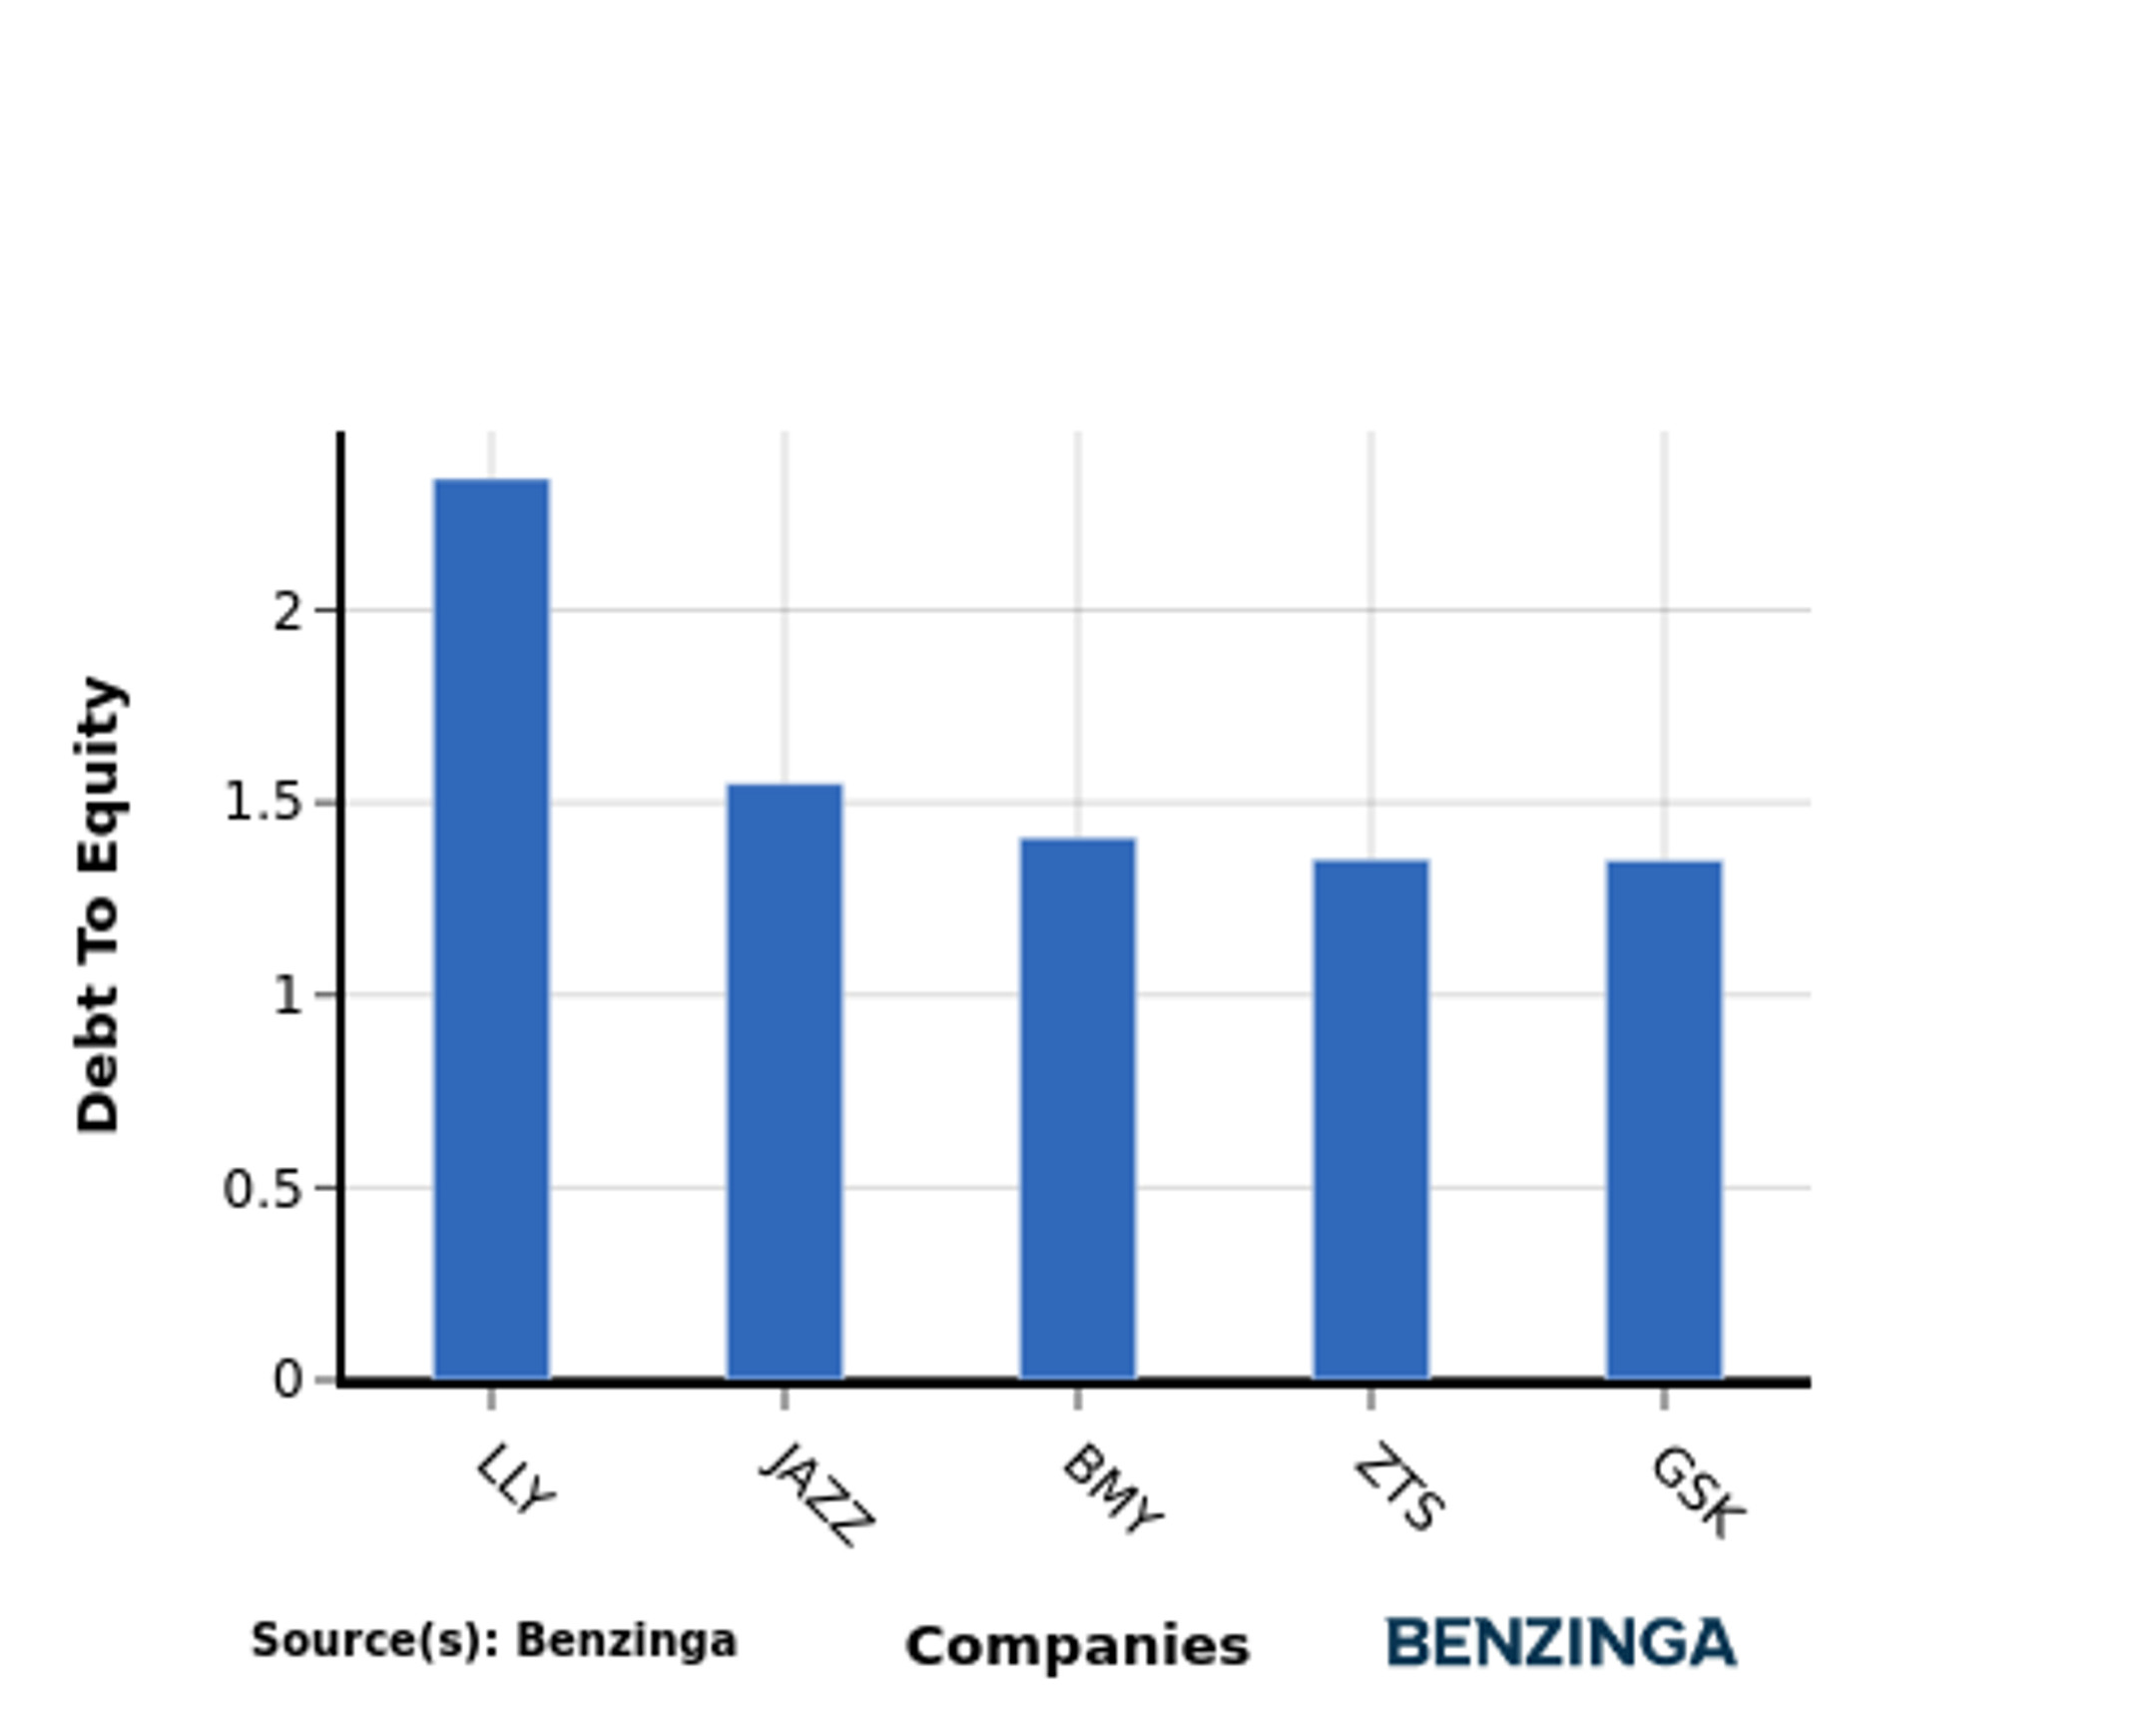
The debt-to-equity (D/E) ratio is a measure that indicates the level of debt a company has taken on relative to the value of its assets net of liabilities.
Considering the debt-to-equity ratio in industry comparisons allows for a concise evaluation of a company's financial health and risk profile, aiding in informed decision-making.
When comparing Eli Lilly and Co with its top 4 peers based on the Debt-to-Equity ratio, the following insights can be observed:
-
In terms of the debt-to-equity ratio, Eli Lilly and Co has a relatively higher level of debt of 2.34 compared to its top 4 peers.
-
This could be seen as a potential risk factor for the company, as a higher debt burden may increase financial vulnerability.
Key Takeaways
For Eli Lilly and Co in the Pharmaceuticals industry, the PE, PB, and PS ratios are all high compared to its peers, indicating potentially overvalued stock. On the other hand, the high ROE and revenue growth suggest strong profitability and future prospects. However, the low EBITDA and gross profit may raise concerns about operational efficiency and cost management within the company.
This article was generated by Benzinga's automated content engine and reviewed by an editor.
© 2024 Benzinga.com. Benzinga does not provide investment advice. All rights reserved.
Trade confidently with insights and alerts from analyst ratings, free reports and breaking news that affects the stocks you care about.

