


In the ever-changing and fiercely competitive business landscape, conducting thorough company analysis is crucial for investors and industry experts. In this article, we will undertake a comprehensive industry comparison, evaluating Uber Technologies UBER and its primary competitors in the Ground Transportation industry. By closely examining key financial metrics, market position, and growth prospects, our aim is to provide valuable insights for investors and shed light on company's performance within the industry.
Uber Technologies Background
Uber Technologies is a technology provider that matches riders with drivers, hungry people with restaurants and food delivery service providers, and shippers with carriers. The firm's on-demand technology platform could eventually be used for additional products and services, such as autonomous vehicles, delivery via drones, and Uber Elevate, which, as the firm refers to it, provides "aerial ride-sharing." Uber Technologies is headquartered in San Francisco and operates in over 63 countries with over 150 million users who order rides or food at least once a month.
| Company | P/E | P/B | P/S | ROE | EBITDA (in billions) | Gross Profit (in billions) | Revenue Growth |
|---|---|---|---|---|---|---|---|
| Uber Technologies Inc | 88.48 | 14.24 | 4.32 | 13.87% | $2.19 | $3.88 | 15.44% |
| Hertz Global Holdings Inc | 5.38 | 0.74 | 0.26 | -10.74% | $0.71 | $0.07 | 7.32% |
| Average | 5.38 | 0.74 | 0.26 | -10.74% | $0.71 | $0.07 | 7.32% |
When analyzing Uber Technologies, the following trends become evident:
-
At 88.48, the stock's Price to Earnings ratio significantly exceeds the industry average by 16.45x, suggesting a premium valuation relative to industry peers.
-
It could be trading at a premium in relation to its book value, as indicated by its Price to Book ratio of 14.24 which exceeds the industry average by 19.24x.
-
With a relatively high Price to Sales ratio of 4.32, which is 16.62x the industry average, the stock might be considered overvalued based on sales performance.
-
The company has a higher Return on Equity (ROE) of 13.87%, which is 24.61% above the industry average. This suggests efficient use of equity to generate profits and demonstrates profitability and growth potential.
-
The company exhibits higher Earnings Before Interest, Taxes, Depreciation, and Amortization (EBITDA) of $2.19 Billion, which is 3.08x above the industry average, implying stronger profitability and robust cash flow generation.
-
The company has higher gross profit of $3.88 Billion, which indicates 55.43x above the industry average, indicating stronger profitability and higher earnings from its core operations.
-
The company's revenue growth of 15.44% is notably higher compared to the industry average of 7.32%, showcasing exceptional sales performance and strong demand for its products or services.
Debt To Equity Ratio

The debt-to-equity (D/E) ratio is a financial metric that helps determine the level of financial risk associated with a company's capital structure.
Considering the debt-to-equity ratio in industry comparisons allows for a concise evaluation of a company's financial health and risk profile, aiding in informed decision-making.
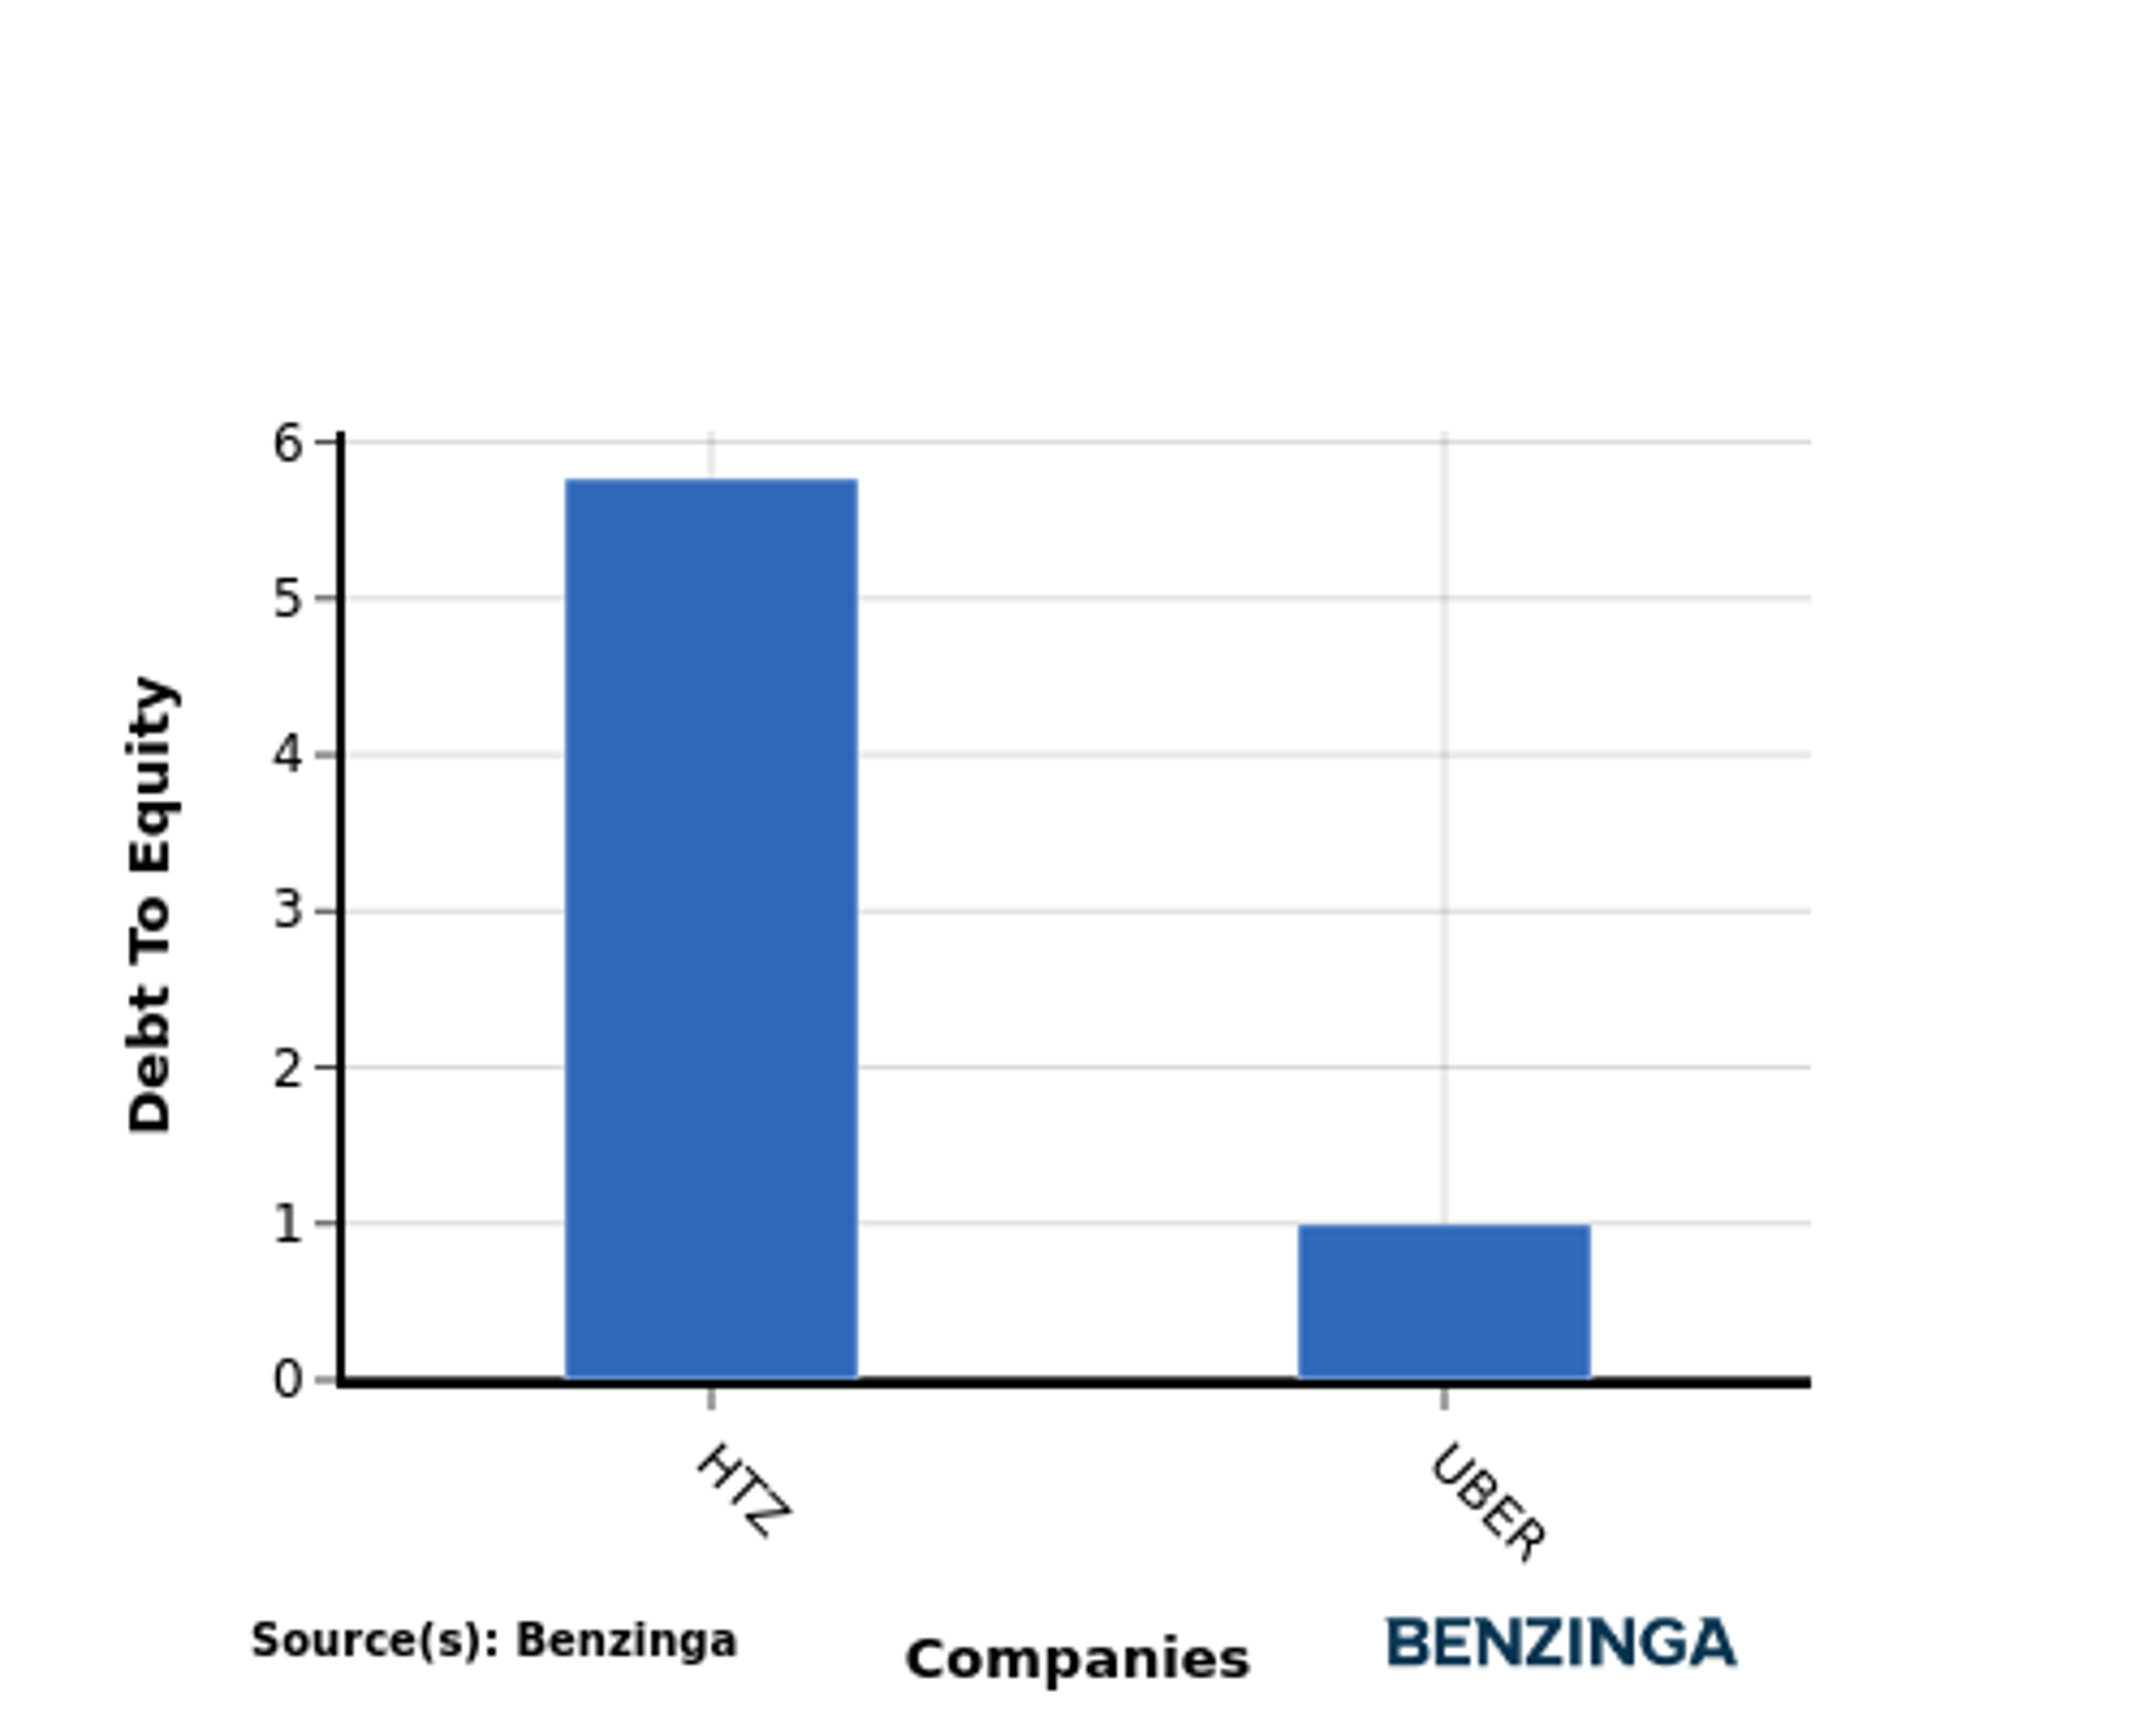
When examining Uber Technologies in comparison to its top 4 peers with respect to the Debt-to-Equity ratio, the following information becomes apparent:
-
As Uber Technologies is in the middle of the list in terms of the debt-to-equity ratio, it suggests that the company has a moderate debt-to-equity ratio of 1.0 compared to the other companies.
-
This position indicates a relatively balanced financial structure, where the company maintains a reasonable level of debt while also leveraging equity for financing its operations.
Key Takeaways
For Uber Technologies, the PE, PB, and PS ratios are all high compared to its peers in the Ground Transportation industry, indicating that the stock may be overvalued based on these metrics. On the other hand, Uber Technologies shows high ROE, EBITDA, gross profit, and revenue growth compared to its industry peers, suggesting strong operational performance and growth potential within the sector.
This article was generated by Benzinga's automated content engine and reviewed by an editor.
© 2024 Benzinga.com. Benzinga does not provide investment advice. All rights reserved.
Trade confidently with insights and alerts from analyst ratings, free reports and breaking news that affects the stocks you care about.

