


Amidst the fast-paced and highly competitive business environment of today, conducting comprehensive company analysis is essential for investors and industry enthusiasts. In this article, we will delve into an extensive industry comparison, evaluating Salesforce CRM in comparison to its major competitors within the Software industry. By analyzing critical financial metrics, market position, and growth potential, our objective is to provide valuable insights for investors and offer a deeper understanding of company's performance in the industry.
Salesforce Background
Salesforce Inc provides enterprise cloud computing solutions. The company offers customer relationship management technology that brings companies and customers together. Its Customer 360 platform helps the group to deliver a single source of truth, connecting customer data across systems, apps, and devices to help companies sell, service, market, and conduct commerce. It also offers Service Cloud for customer support, Marketing Cloud for digital marketing campaigns, Commerce Cloud as an e-commerce engine, the Salesforce Platform, which allows enterprises to build applications, and other solutions, such as MuleSoft for data integration.
| Company | P/E | P/B | P/S | ROE | EBITDA (in billions) | Gross Profit (in billions) | Revenue Growth |
|---|---|---|---|---|---|---|---|
| Salesforce Inc | 72.38 | 4.94 | 8.58 | 2.46% | $2.75 | $7.14 | 10.77% |
| SAP SE | 57.80 | 4.81 | 6.73 | 3.05% | $2.32 | $6.2 | 5.02% |
| Adobe Inc | 47.68 | 14.47 | 11.47 | 3.88% | $1.21 | $4.59 | 11.32% |
| Intuit Inc | 64.01 | 10.38 | 11.77 | 2.08% | $0.6 | $2.53 | 11.34% |
| Synopsys Inc | 62.89 | 13.03 | 14.43 | 7.01% | $0.53 | $1.32 | 21.15% |
| Cadence Design Systems Inc | 80.20 | 24.53 | 20.43 | 9.94% | $0.41 | $0.96 | 18.75% |
| Workday Inc | 52.14 | 8.88 | 9.93 | 16.16% | $0.24 | $1.46 | 16.75% |
| Roper Technologies Inc | 42.85 | 3.35 | 9.49 | 2.26% | $0.72 | $1.13 | 12.76% |
| Autodesk Inc | 59.33 | 28.67 | 9.77 | 16.9% | $0.35 | $1.34 | 3.89% |
| Palantir Technologies Inc | 252.44 | 14.46 | 23.46 | 2.8% | $0.11 | $0.5 | 19.61% |
| Datadog Inc | 888.64 | 20.39 | 20.48 | 2.82% | $0.07 | $0.48 | 25.62% |
| Ansys Inc | 60.28 | 5.58 | 13.30 | 5.29% | $0.37 | $0.74 | 15.99% |
| MicroStrategy Inc | 59.76 | 12.38 | 52.71 | 5.93% | $-0.04 | $0.1 | -6.09% |
| AppLovin Corp | 71.16 | 18.40 | 7.70 | 14.58% | $0.37 | $0.68 | 35.73% |
| PTC Inc | 94.25 | 7.95 | 10.24 | 2.42% | $0.16 | $0.44 | 18.09% |
| Zoom Video Communications Inc | 30.80 | 2.45 | 4.35 | 3.87% | $0.2 | $0.87 | 2.56% |
| Tyler Technologies Inc | 106.67 | 5.98 | 9.07 | 1.34% | $0.09 | $0.21 | 6.35% |
| NICE Ltd | 49.24 | 4.75 | 7.01 | 2.49% | $0.19 | $0.42 | 9.61% |
| Manhattan Associates Inc | 86.06 | 53.69 | 16.36 | 19.96% | $0.06 | $0.13 | 20.27% |
| Bentley Systems Inc | 50.15 | 16.88 | 13.57 | 22.81% | $0.05 | $0.24 | 8.26% |
| Dynatrace Inc | 68.86 | 7.03 | 9.90 | 2.3% | $0.05 | $0.3 | 22.74% |
| Average | 114.26 | 13.9 | 14.11 | 7.39% | $0.4 | $1.23 | 13.99% |
By conducting a comprehensive analysis of Salesforce, the following trends become evident:
-
At 72.38, the stock's Price to Earnings ratio is 0.63x less than the industry average, suggesting favorable growth potential.
-
With a Price to Book ratio of 4.94, significantly falling below the industry average by 0.36x, it suggests undervaluation and the possibility of untapped growth prospects.
-
The Price to Sales ratio is 8.58, which is 0.61x the industry average. This suggests a possible undervaluation based on sales performance.
-
The Return on Equity (ROE) of 2.46% is 4.93% below the industry average, suggesting potential inefficiency in utilizing equity to generate profits.
-
Compared to its industry, the company has higher Earnings Before Interest, Taxes, Depreciation, and Amortization (EBITDA) of $2.75 Billion, which is 6.88x above the industry average, indicating stronger profitability and robust cash flow generation.
-
With higher gross profit of $7.14 Billion, which indicates 5.8x above the industry average, the company demonstrates stronger profitability and higher earnings from its core operations.
-
The company is witnessing a substantial decline in revenue growth, with a rate of 10.77% compared to the industry average of 13.99%, which indicates a challenging sales environment.
Debt To Equity Ratio

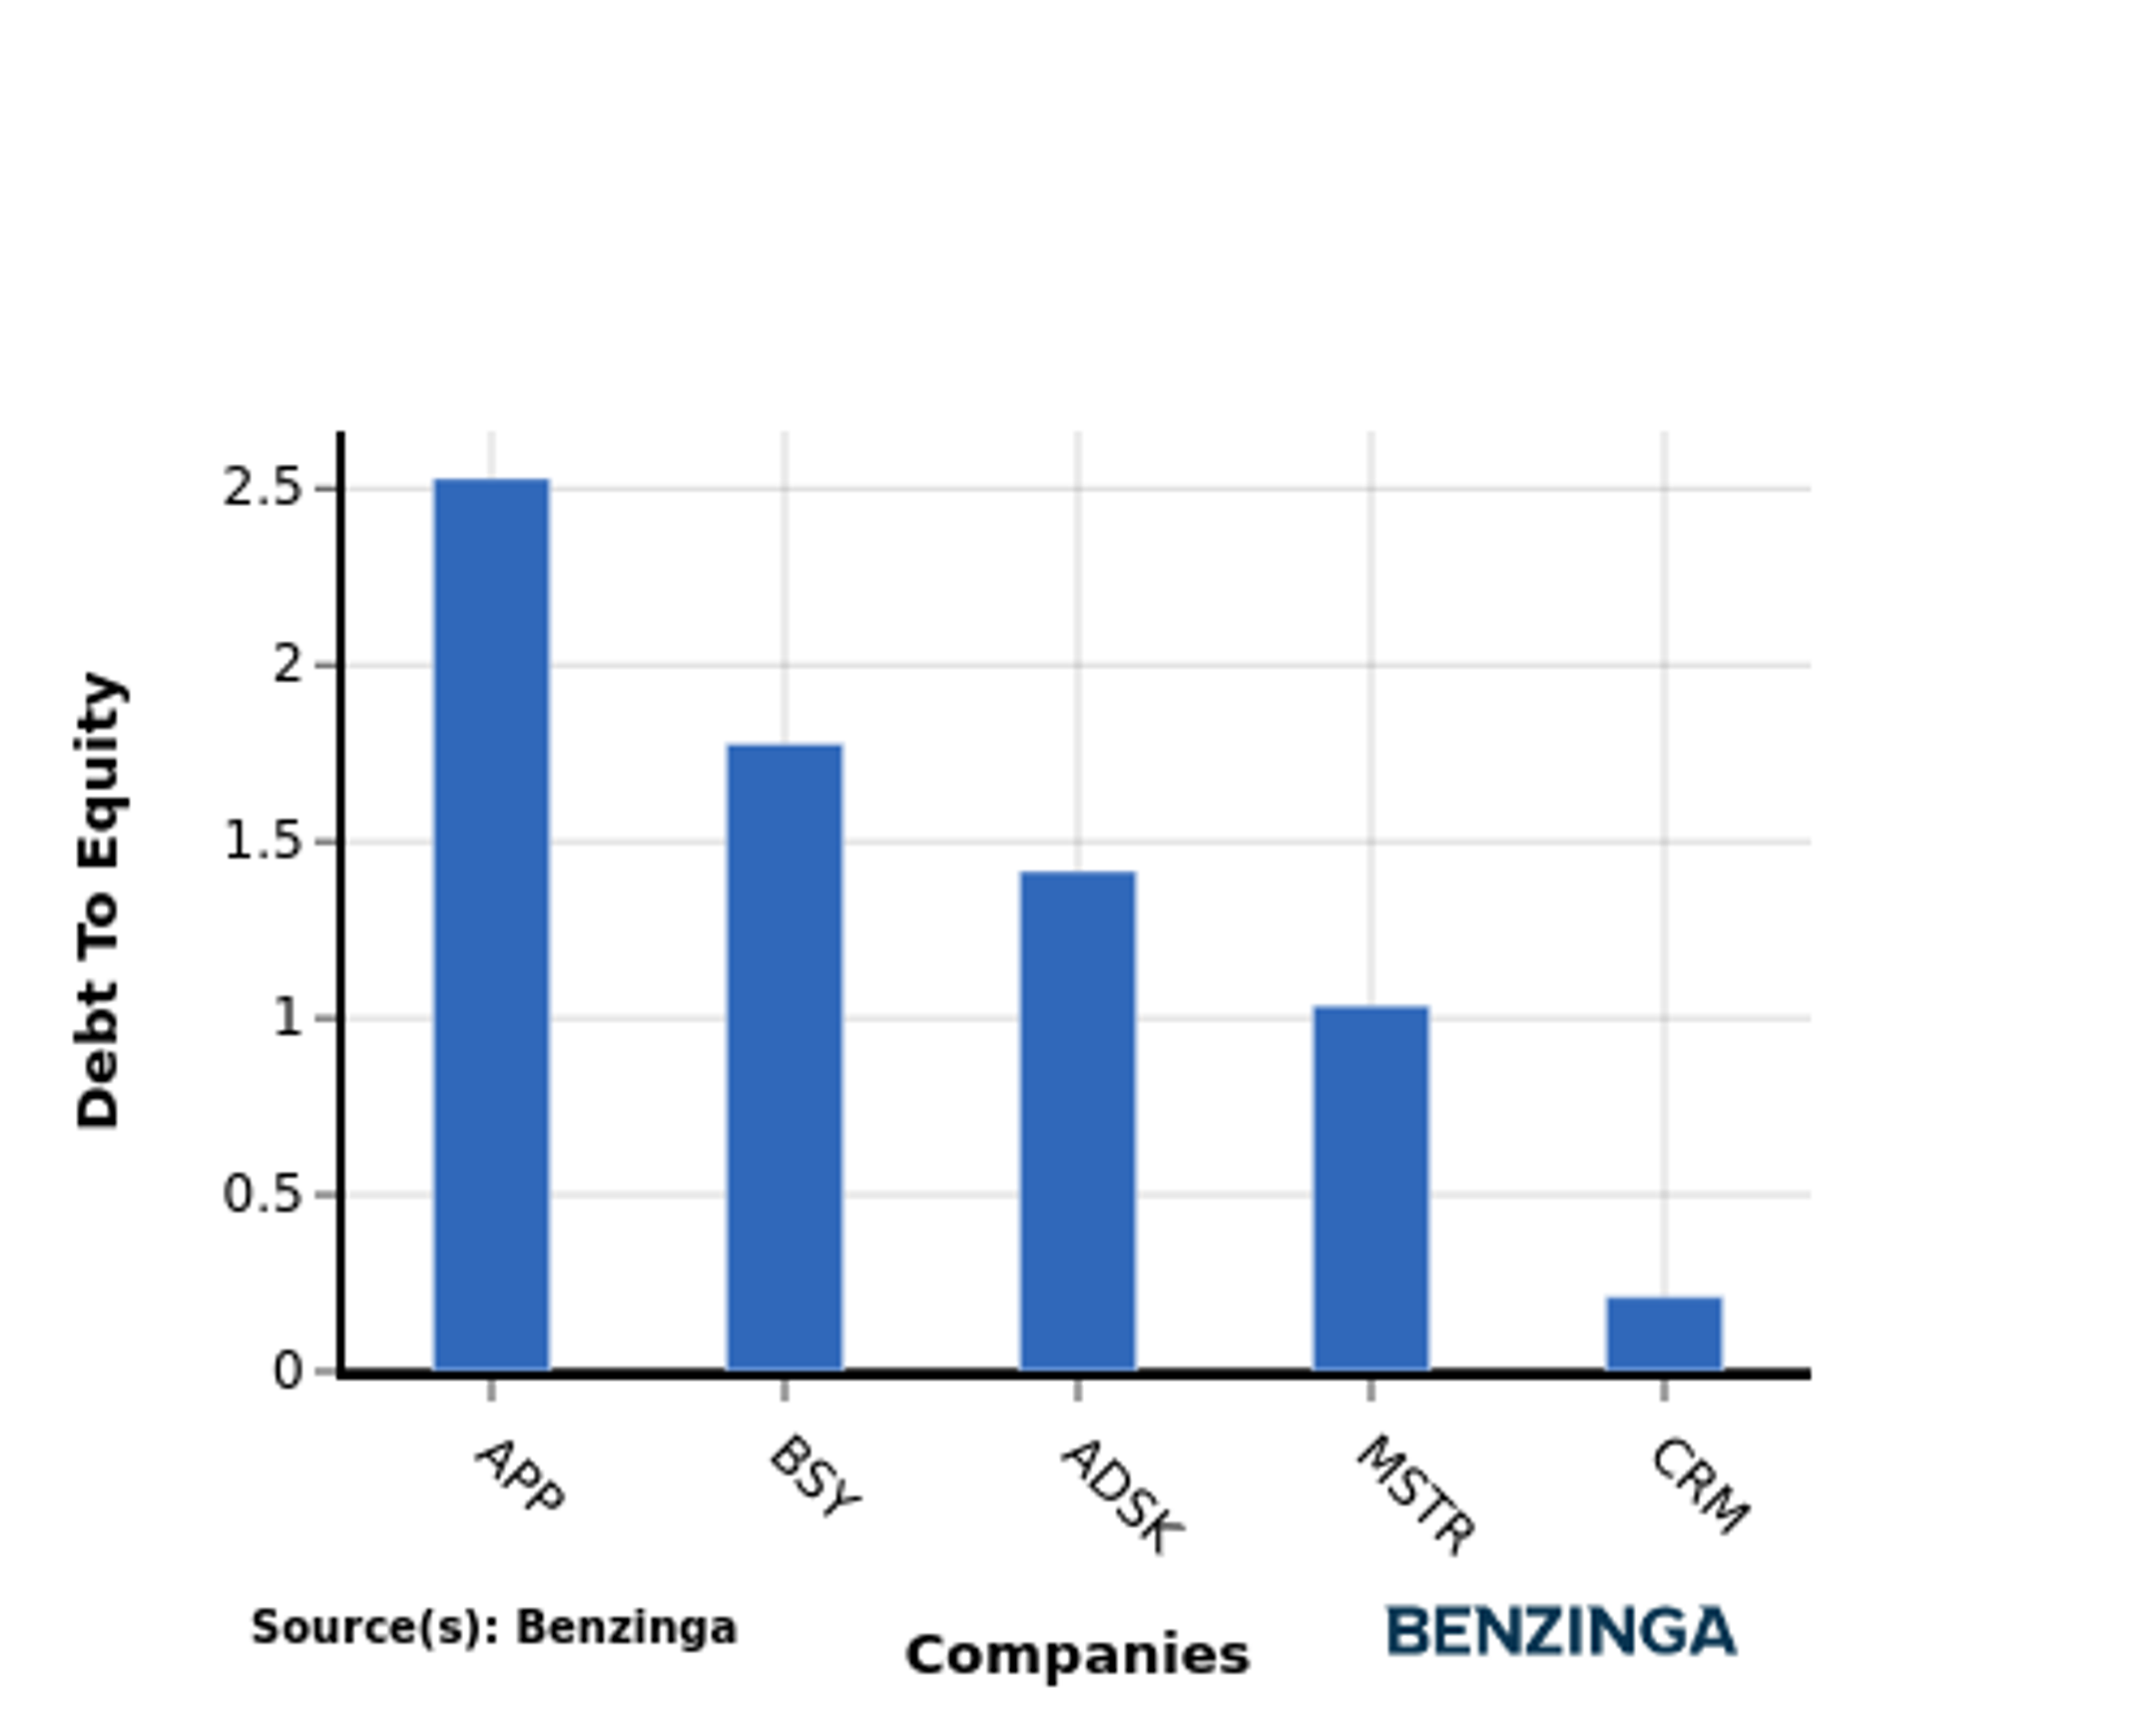
The debt-to-equity (D/E) ratio is an important measure to assess the financial structure and risk profile of a company.
Considering the debt-to-equity ratio in industry comparisons allows for a concise evaluation of a company's financial health and risk profile, aiding in informed decision-making.
When evaluating Salesforce alongside its top 4 peers in terms of the Debt-to-Equity ratio, the following insights arise:
-
Compared to its top 4 peers, Salesforce has a stronger financial position indicated by its lower debt-to-equity ratio of 0.21.
-
This suggests that the company relies less on debt financing and has a more favorable balance between debt and equity, which can be seen as a positive attribute by investors.
Key Takeaways
For Salesforce, the PE, PB, and PS ratios are all low compared to industry peers, indicating potential undervaluation. However, the low ROE suggests lower profitability compared to peers. The high EBITDA and gross profit levels suggest strong operational performance, while the low revenue growth may indicate slower expansion compared to industry peers in the Software sector.
This article was generated by Benzinga's automated content engine and reviewed by an editor.
© 2024 Benzinga.com. Benzinga does not provide investment advice. All rights reserved.
Trade confidently with insights and alerts from analyst ratings, free reports and breaking news that affects the stocks you care about.

