


In the fast-paced and cutthroat world of business, conducting thorough company analysis is essential for investors and industry experts. In this article, we will undertake a comprehensive industry comparison, evaluating NVIDIA NVDA in comparison to its major competitors within the Semiconductors & Semiconductor Equipment industry. By analyzing crucial financial metrics, market position, and growth potential, our objective is to provide valuable insights for investors and offer a deeper understanding of company's performance in the industry.
NVIDIA Background
Nvidia is a leading developer of graphics processing units. Traditionally, GPUs were used to enhance the experience on computing platforms, most notably in gaming applications on PCs. GPU use cases have since emerged as important semiconductors used in artificial intelligence. Nvidia not only offers AI GPUs, but also a software platform, Cuda, used for AI model development and training. Nvidia is also expanding its data center networking solutions, helping to tie GPUs together to handle complex workloads.
| Company | P/E | P/B | P/S | ROE | EBITDA (in billions) | Gross Profit (in billions) | Revenue Growth |
|---|---|---|---|---|---|---|---|
| NVIDIA Corp | 73.72 | 51.16 | 36.01 | 32.23% | $14.56 | $16.79 | 265.28% |
| Broadcom Inc | 46.91 | 8.32 | 14.18 | 2.81% | $4.61 | $7.38 | 28.68% |
| Advanced Micro Devices Inc | 353.64 | 5.42 | 13.43 | 1.2% | $1.22 | $2.91 | 10.16% |
| Qualcomm Inc | 24.03 | 8.15 | 5.22 | 12.4% | $3.58 | $5.62 | 4.99% |
| Intel Corp | 106.88 | 1.71 | 3.32 | 2.57% | $5.57 | $7.05 | 9.71% |
| Texas Instruments Inc | 24.21 | 9.22 | 8.95 | 8.14% | $1.98 | $2.43 | -12.7% |
| ARM Holdings PLC | 1583.96 | 26.91 | 45.83 | 1.78% | $0.18 | $0.79 | 13.81% |
| Analog Devices Inc | 34.72 | 2.71 | 8.45 | 1.3% | $1.12 | $1.47 | -22.68% |
| Microchip Technology Inc | 20.79 | 6.79 | 5.73 | 5.97% | $0.75 | $1.12 | -18.6% |
| Monolithic Power Systems Inc | 79.11 | 16.45 | 18.56 | 4.85% | $0.12 | $0.25 | -1.3% |
| ON Semiconductor Corp | 15.78 | 4.24 | 4.18 | 7.37% | $0.79 | $0.94 | -4.06% |
| GLOBALFOUNDRIES Inc | 28.72 | 2.62 | 3.95 | 2.53% | $0.73 | $0.53 | 0.11% |
| ASE Technology Holding Co Ltd | 24.03 | 2.50 | 1.29 | 3.17% | $28.28 | $25.76 | 4.16% |
| United Microelectronics Corp | 9.29 | 1.85 | 2.74 | 4.72% | $29.0 | $20.46 | -24.3% |
| Skyworks Solutions Inc | 18.64 | 2.71 | 3.63 | 3.76% | $0.37 | $0.51 | -9.61% |
| First Solar Inc | 19.30 | 2.39 | 4.83 | 5.38% | $0.47 | $0.5 | 15.58% |
| Lattice Semiconductor Corp | 41.36 | 15.21 | 14.51 | 14.98% | $0.05 | $0.12 | -3.05% |
| Universal Display Corp | 37.71 | 5.23 | 13.21 | 4.36% | $0.08 | $0.12 | -6.34% |
| Rambus Inc | 20.26 | 6.38 | 14.67 | 5.87% | $0.07 | $0.1 | -0.12% |
| MACOM Technology Solutions Holdings Inc | 86.55 | 6.33 | 10.32 | 1.27% | $0.03 | $0.09 | -12.75% |
| Allegro Microsystems Inc | 24.94 | 4.84 | 5.14 | 2.99% | $0.06 | $0.13 | 2.49% |
| Average | 130.04 | 7.0 | 10.11 | 4.87% | $3.95 | $3.91 | -1.29% |
By closely studying NVIDIA, we can observe the following trends:
-
At 73.72, the stock's Price to Earnings ratio is 0.57x less than the industry average, suggesting favorable growth potential.
-
The elevated Price to Book ratio of 51.16 relative to the industry average by 7.31x suggests company might be overvalued based on its book value.
-
The Price to Sales ratio of 36.01, which is 3.56x the industry average, suggests the stock could potentially be overvalued in relation to its sales performance compared to its peers.
-
The company has a higher Return on Equity (ROE) of 32.23%, which is 27.36% above the industry average. This suggests efficient use of equity to generate profits and demonstrates profitability and growth potential.
-
With higher Earnings Before Interest, Taxes, Depreciation, and Amortization (EBITDA) of $14.56 Billion, which is 3.69x above the industry average, the company demonstrates stronger profitability and robust cash flow generation.
-
The gross profit of $16.79 Billion is 4.29x above that of its industry, highlighting stronger profitability and higher earnings from its core operations.
-
The company is experiencing remarkable revenue growth, with a rate of 265.28%, outperforming the industry average of -1.29%.
Debt To Equity Ratio

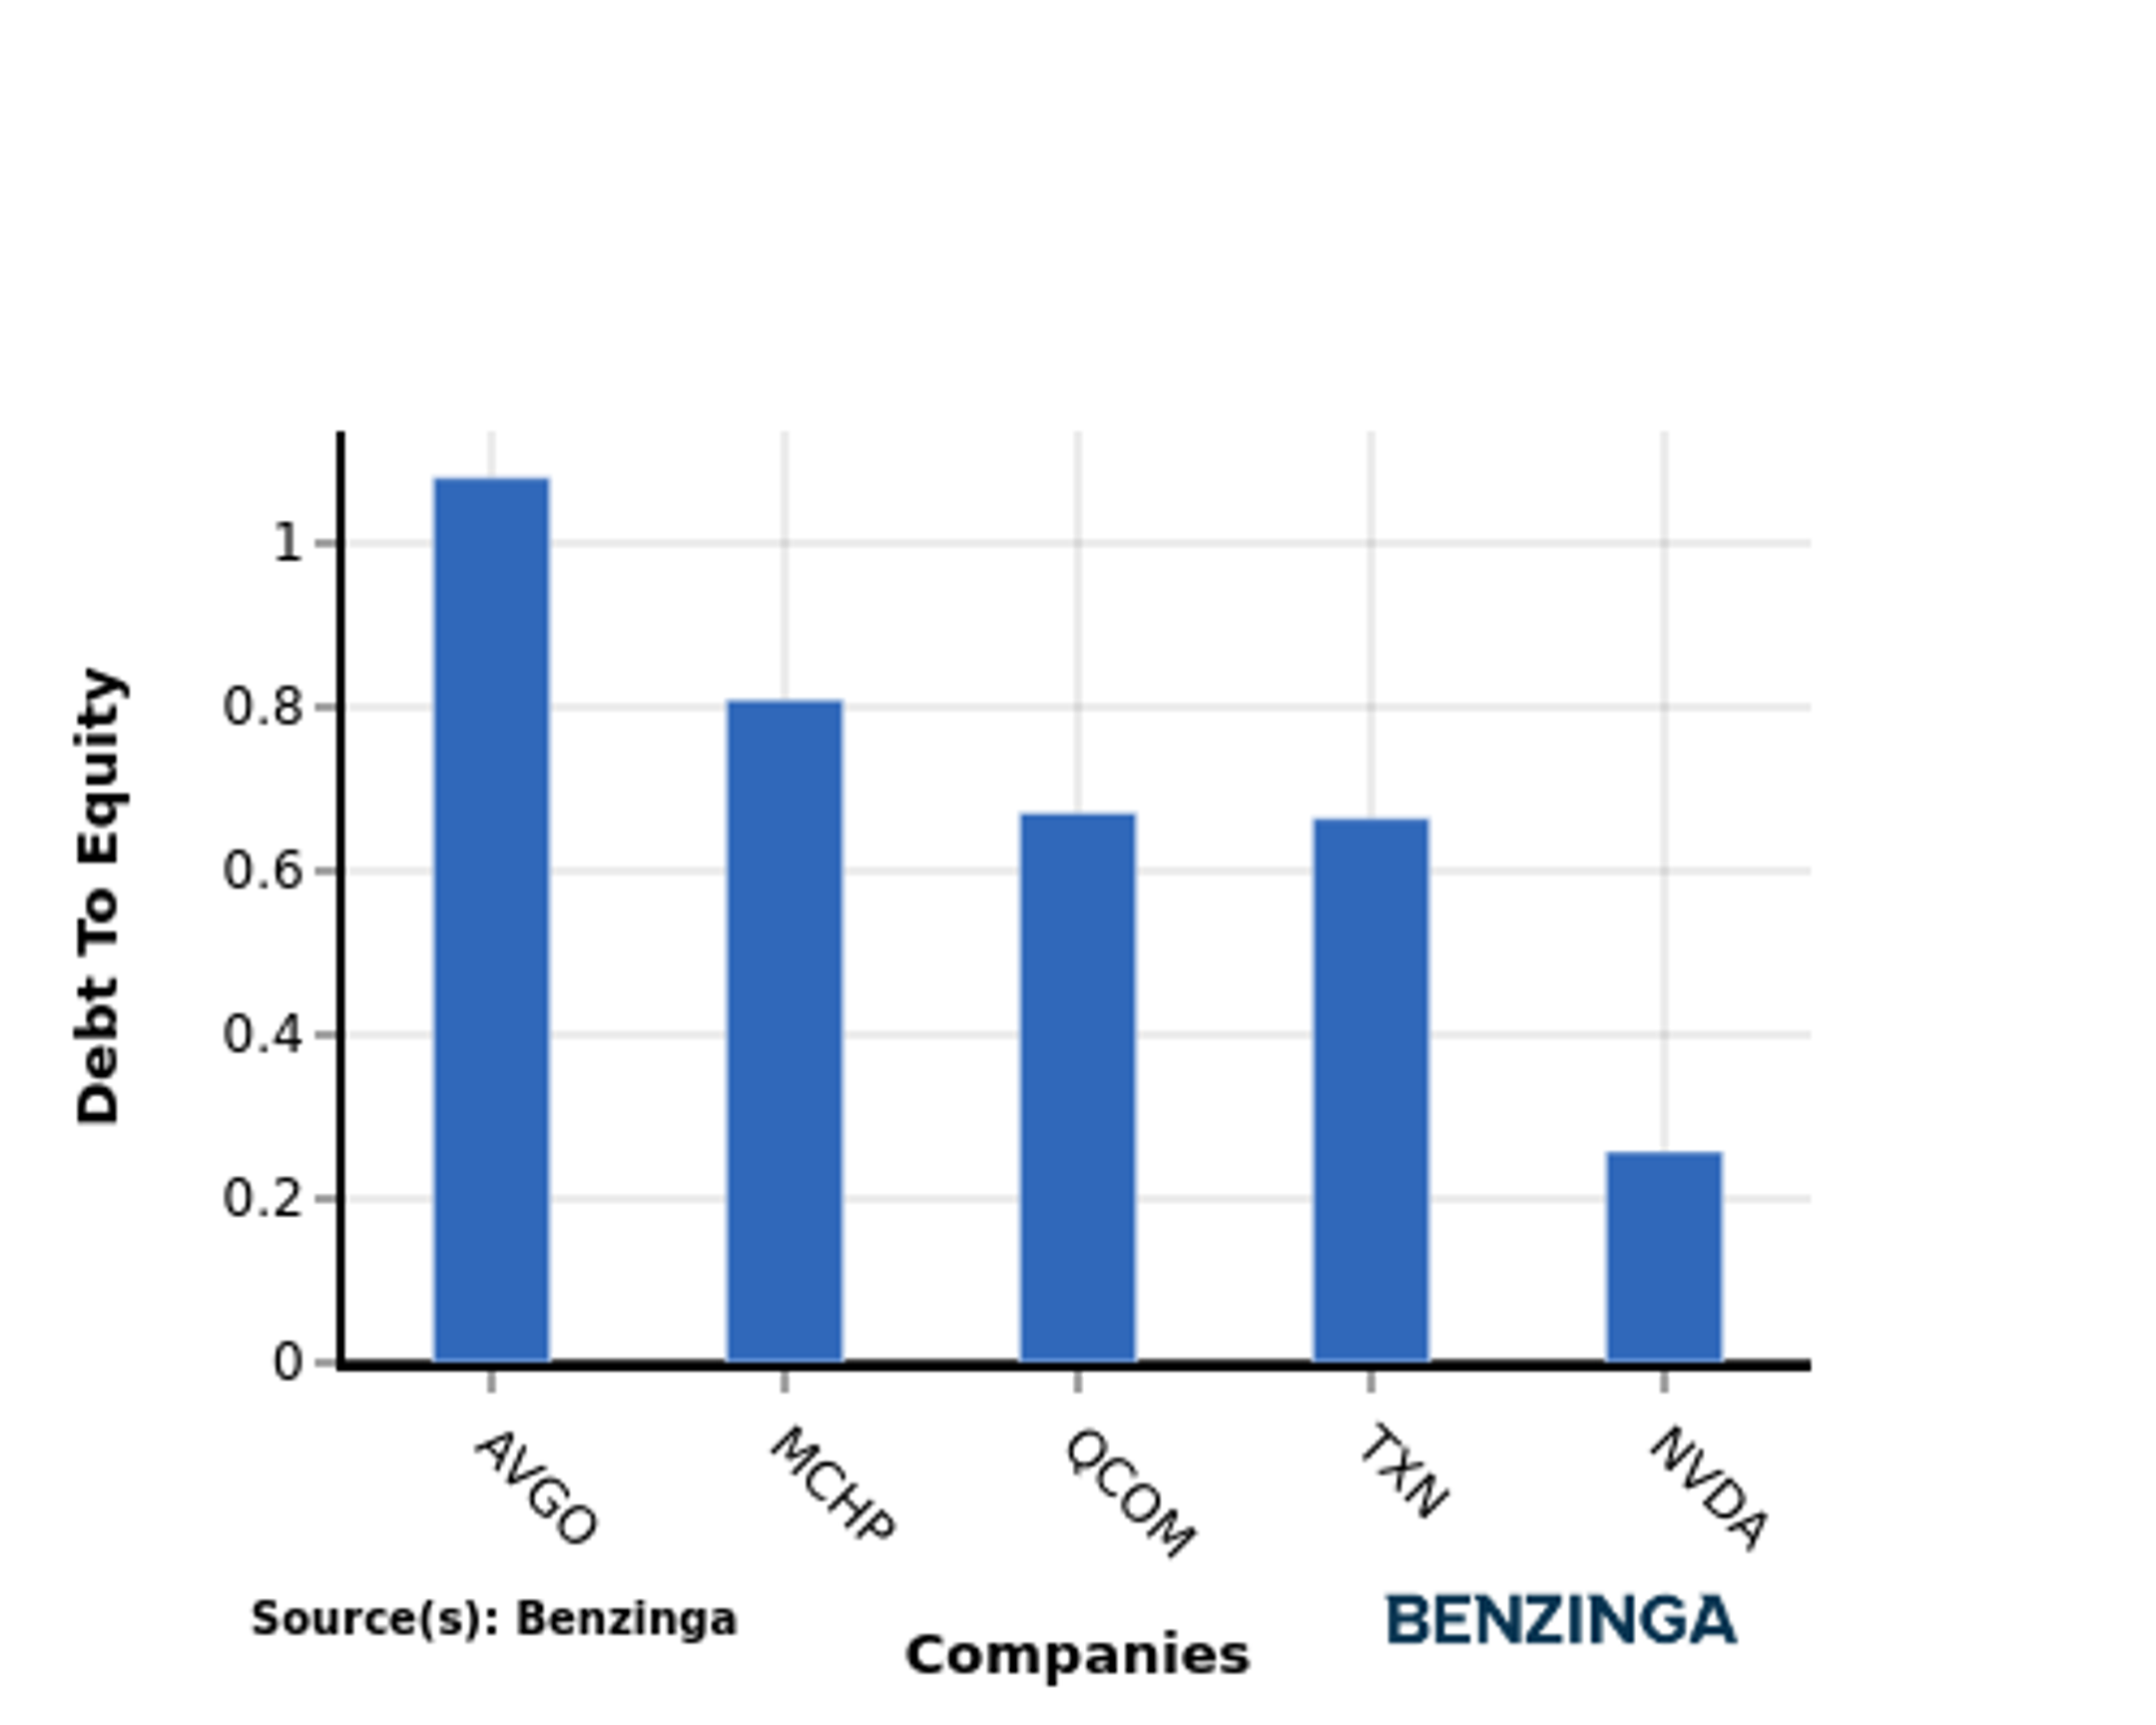
The debt-to-equity (D/E) ratio provides insights into the proportion of debt a company has in relation to its equity and asset value.
Considering the debt-to-equity ratio in industry comparisons allows for a concise evaluation of a company's financial health and risk profile, aiding in informed decision-making.
When evaluating NVIDIA alongside its top 4 peers in terms of the Debt-to-Equity ratio, the following insights arise:
-
Among its top 4 peers, NVIDIA has a stronger financial position with a lower debt-to-equity ratio of 0.26.
-
This indicates that the company relies less on debt financing and maintains a more favorable balance between debt and equity, which can be viewed positively by investors.
Key Takeaways
For NVIDIA, the PE ratio is low compared to peers, indicating potential undervaluation. The high PB and PS ratios suggest strong market sentiment and revenue multiples. In terms of ROE, EBITDA, gross profit, and revenue growth, NVIDIA outperforms industry peers, reflecting strong financial performance and growth prospects.
This article was generated by Benzinga's automated content engine and reviewed by an editor.
© 2024 Benzinga.com. Benzinga does not provide investment advice. All rights reserved.
Trade confidently with insights and alerts from analyst ratings, free reports and breaking news that affects the stocks you care about.

