


In today's fast-paced and highly competitive business world, it is crucial for investors and industry followers to conduct comprehensive company evaluations. In this article, we will delve into an extensive industry comparison, evaluating Palantir Technologies PLTR in relation to its major competitors in the Software industry. By closely examining key financial metrics, market standing, and growth prospects, our objective is to provide valuable insights and highlight company's performance in the industry.
Palantir Technologies Background
Palantir is an analytical software company that focuses on leveraging data to create efficiencies in its clients' organizations. The firm serves commercial and government clients via its Foundry and Gotham platforms, respectively. The Denver-based company was founded in 2003 and went public in 2020.
| Company | P/E | P/B | P/S | ROE | EBITDA (in billions) | Gross Profit (in billions) | Revenue Growth |
|---|---|---|---|---|---|---|---|
| Palantir Technologies Inc | 264.56 | 15.16 | 24.59 | 2.8% | $0.11 | $0.5 | 19.61% |
| Salesforce Inc | 71.13 | 4.85 | 8.43 | 2.46% | $2.75 | $7.14 | 6.5% |
| Adobe Inc | 46.09 | 14.93 | 12.88 | 9.18% | $2.06 | $4.41 | 11.56% |
| SAP SE | 56.07 | 4.67 | 6.53 | 3.05% | $2.52 | $6.2 | 5.02% |
| Intuit Inc | 65.37 | 10.60 | 12.02 | 2.08% | $0.6 | $2.53 | 11.34% |
| Cadence Design Systems Inc | 80.56 | 24.61 | 20.52 | 9.94% | $0.41 | $0.96 | 18.75% |
| Workday Inc | 51.20 | 8.68 | 9.75 | 16.16% | $0.15 | $1.46 | 3.02% |
| Roper Technologies Inc | 42.15 | 3.29 | 9.33 | 2.26% | $0.72 | $1.13 | 12.76% |
| Autodesk Inc | 59.02 | 28.52 | 9.72 | 16.9% | $0.35 | $1.34 | 3.89% |
| Datadog Inc | 882.36 | 20.24 | 20.33 | 2.82% | $0.07 | $0.48 | 25.62% |
| Ansys Inc | 57.38 | 5.31 | 12.66 | 5.29% | $0.37 | $0.74 | 15.99% |
| Splunk Inc | 102.92 | 35.60 | 6.51 | 90.8% | $0.47 | $1.26 | 39.24% |
| PTC Inc | 90.50 | 7.63 | 9.83 | 2.42% | $0.16 | $0.44 | 18.09% |
| AppLovin Corp | 62.20 | 16.59 | 6.73 | 14.58% | $0.37 | $0.68 | 35.73% |
| Zoom Video Communications Inc | 32.12 | 2.55 | 4.53 | 3.87% | $0.2 | $0.87 | 2.56% |
| MicroStrategy Inc | 39.78 | 8.24 | 35.08 | 5.93% | $-0.04 | $0.1 | -6.09% |
| Tyler Technologies Inc | 107.52 | 6 | 9.14 | 1.34% | $0.09 | $0.21 | 6.35% |
| Manhattan Associates Inc | 89.48 | 55.83 | 17.01 | 19.96% | $0.06 | $0.13 | 20.27% |
| NICE Ltd | 46.77 | 4.53 | 6.66 | 2.49% | $0.16 | $0.42 | 3.63% |
| Bentley Systems Inc | 48.09 | 16.19 | 13.02 | 22.81% | $0.05 | $0.24 | 8.26% |
| Average | 106.88 | 14.68 | 12.14 | 12.33% | $0.61 | $1.62 | 12.76% |
Through a meticulous analysis of Palantir Technologies, we can observe the following trends:
-
The Price to Earnings ratio of 264.56 for this company is 2.48x above the industry average, indicating a premium valuation associated with the stock.
-
The elevated Price to Book ratio of 15.16 relative to the industry average by 1.03x suggests company might be overvalued based on its book value.
-
The stock's relatively high Price to Sales ratio of 24.59, surpassing the industry average by 2.03x, may indicate an aspect of overvaluation in terms of sales performance.
-
The Return on Equity (ROE) of 2.8% is 9.53% below the industry average, suggesting potential inefficiency in utilizing equity to generate profits.
-
The company has lower Earnings Before Interest, Taxes, Depreciation, and Amortization (EBITDA) of $110 Million, which is 0.18x below the industry average. This potentially indicates lower profitability or financial challenges.
-
With lower gross profit of $500 Million, which indicates 0.31x below the industry average, the company may experience lower revenue after accounting for production costs.
-
The company is experiencing remarkable revenue growth, with a rate of 19.61%, outperforming the industry average of 12.76%.
Debt To Equity Ratio

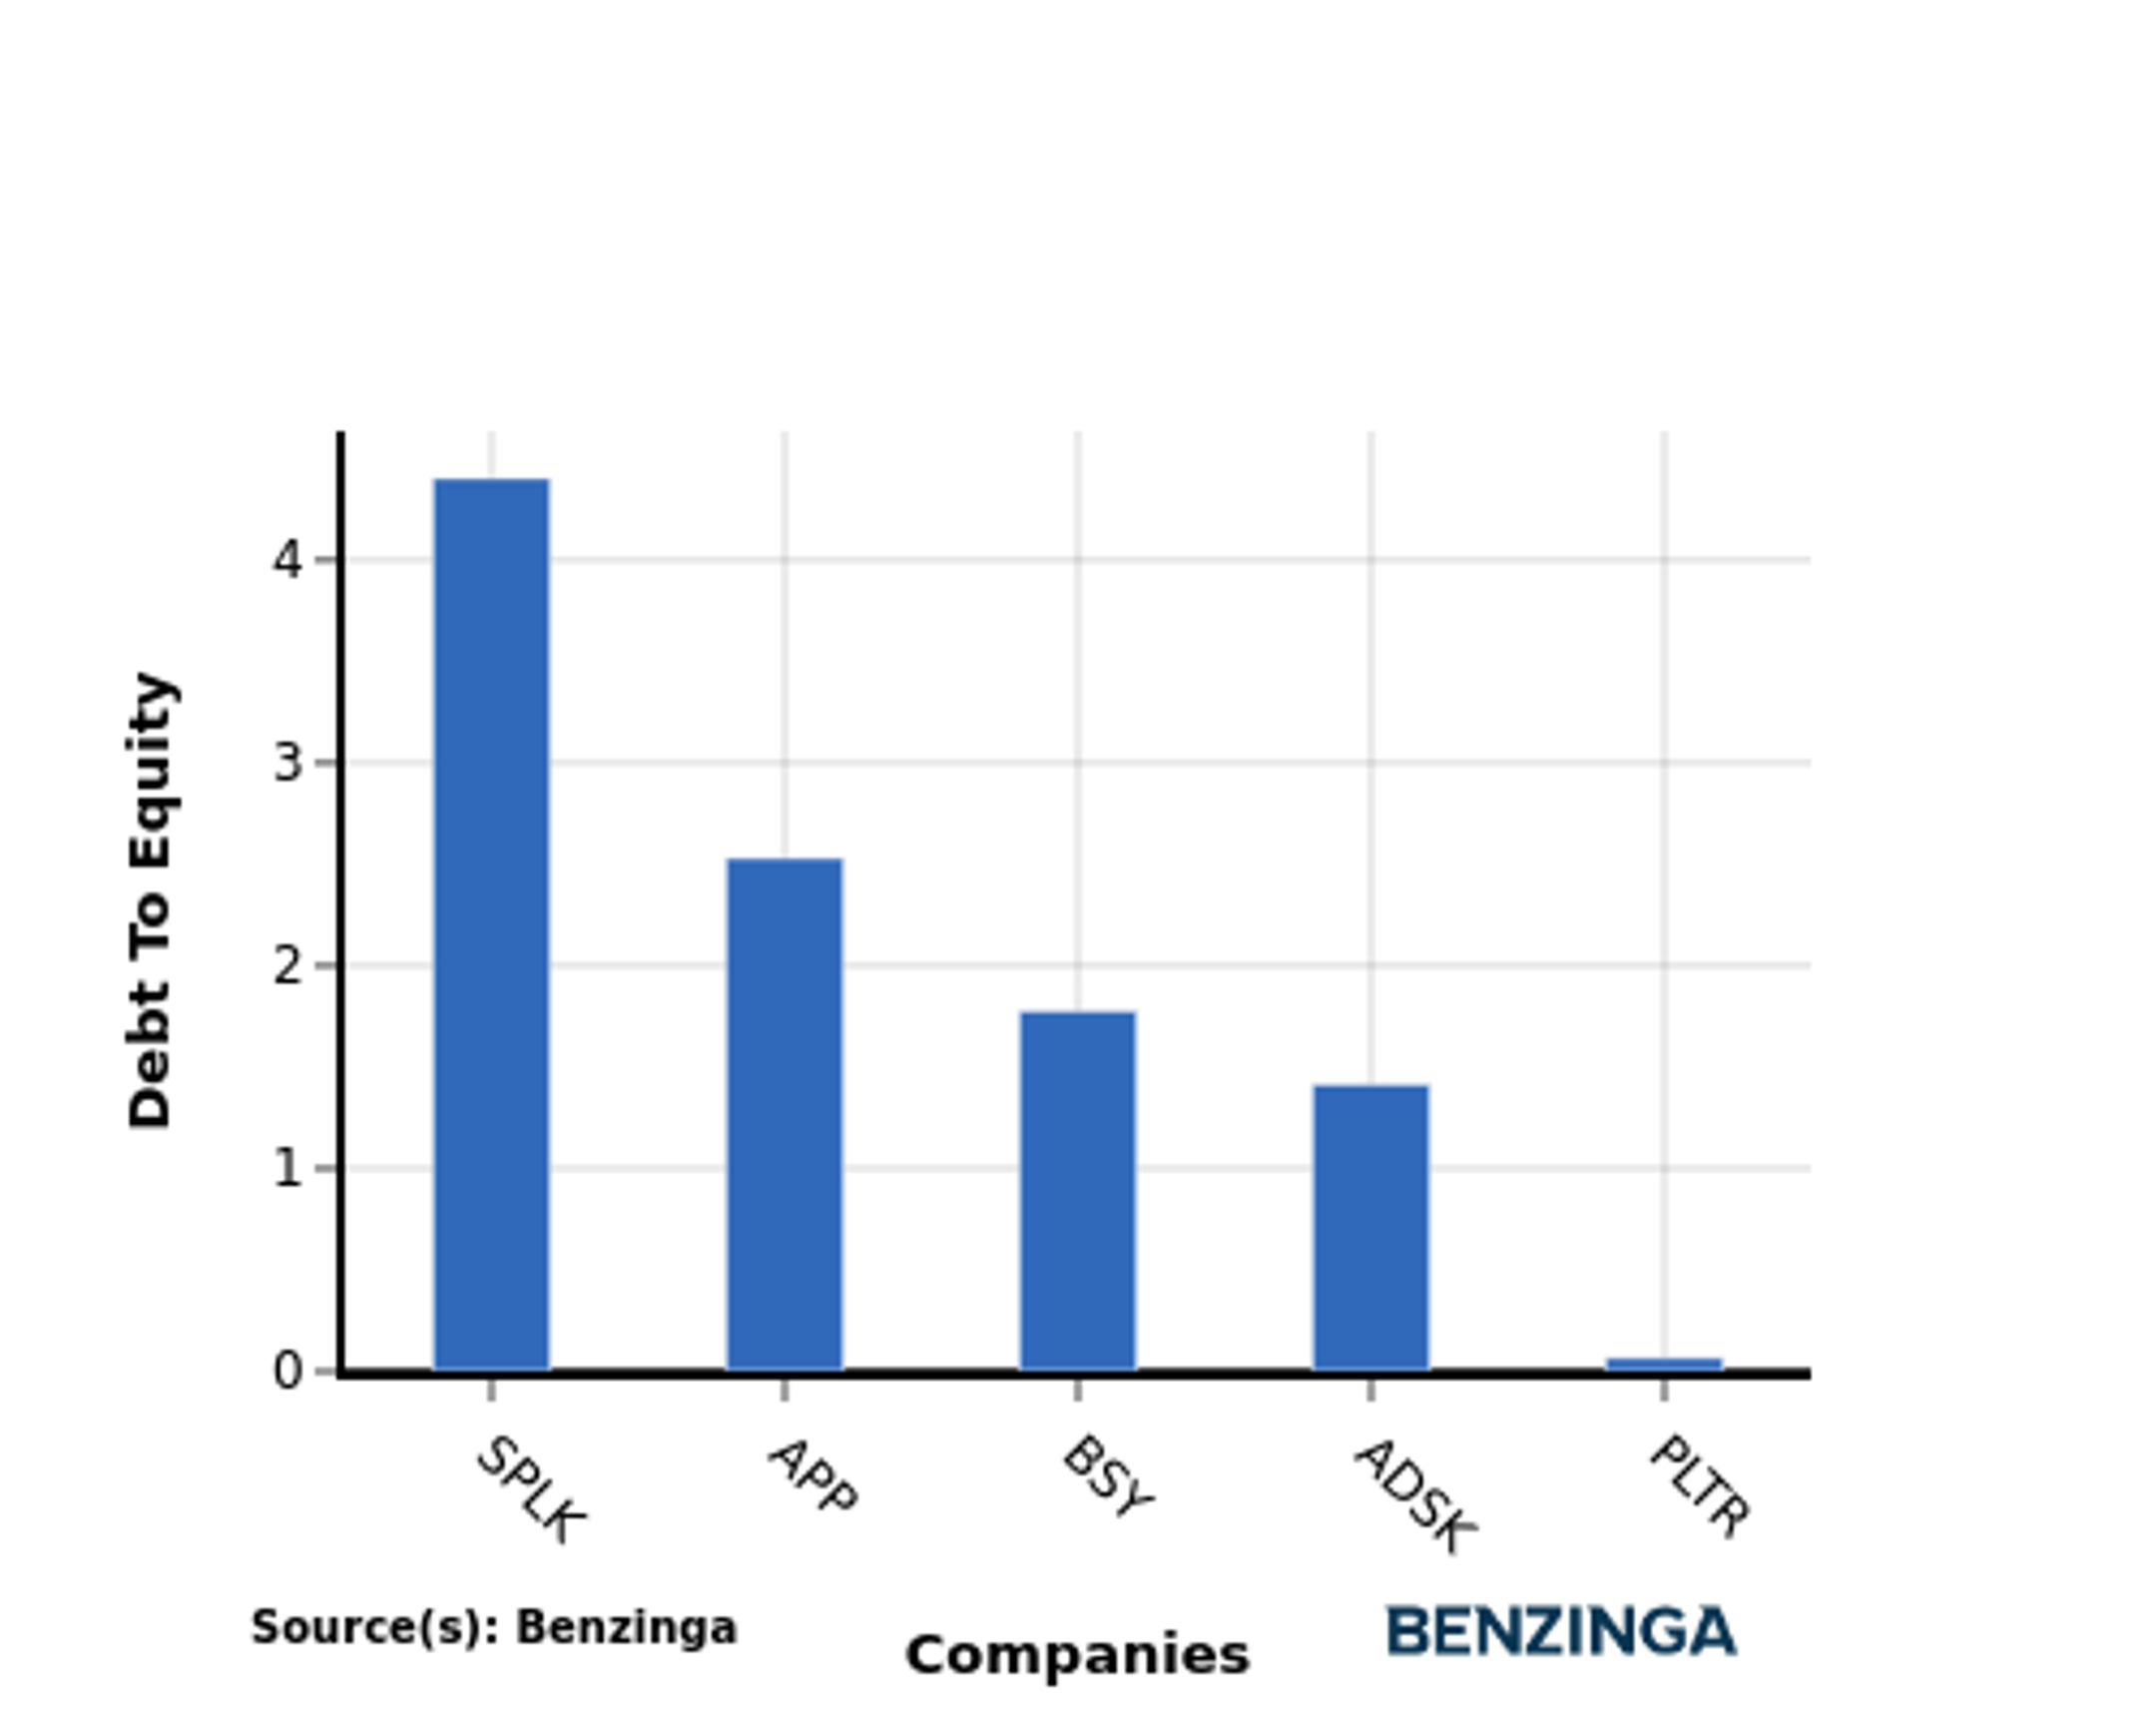
The debt-to-equity (D/E) ratio is a measure that indicates the level of debt a company has taken on relative to the value of its assets net of liabilities.
Considering the debt-to-equity ratio in industry comparisons allows for a concise evaluation of a company's financial health and risk profile, aiding in informed decision-making.
When evaluating Palantir Technologies alongside its top 4 peers in terms of the Debt-to-Equity ratio, the following insights arise:
-
When considering the debt-to-equity ratio, Palantir Technologies exhibits a stronger financial position compared to its top 4 peers.
-
This indicates that the company has a favorable balance between debt and equity, with a lower debt-to-equity ratio of 0.07, which can be perceived as a positive aspect by investors.
Key Takeaways
The high PE, PB, and PS ratios of Palantir Technologies suggest that the company is trading at a premium compared to its peers in the Software industry. However, the low ROE, EBITDA, and gross profit indicate that the company may not be efficiently utilizing its resources to generate profits. On the other hand, the high revenue growth rate implies that Palantir Technologies is experiencing strong top-line growth compared to its industry counterparts.
This article was generated by Benzinga's automated content engine and reviewed by an editor.
© 2024 Benzinga.com. Benzinga does not provide investment advice. All rights reserved.
Trade confidently with insights and alerts from analyst ratings, free reports and breaking news that affects the stocks you care about.

