


In today's fast-paced and competitive business landscape, it is essential for investors and industry enthusiasts to thoroughly analyze companies before making investment decisions. In this article, we will conduct a comprehensive industry comparison, evaluating Meta Platforms META against its key competitors in the Interactive Media & Services industry. By examining key financial metrics, market position, and growth prospects, we aim to provide valuable insights for investors and shed light on company's performance within the industry.
Meta Platforms Background
Meta is the world's largest online social network, with nearly 4 billion family of apps monthly active users. Users engage with each other in different ways, exchanging messages and sharing news events, photos, and videos. The firm's ecosystem consists mainly of the Facebook app, Instagram, Messenger, WhatsApp, and many features surrounding these products. Users can access Facebook on mobile devices and desktops. Advertising revenue represents more than 90% of the firm's total revenue, with more than 45% coming from the U.S. and Canada and over 20% from Europe.
| Company | P/E | P/B | P/S | ROE | EBITDA (in billions) | Gross Profit (in billions) | Revenue Growth |
|---|---|---|---|---|---|---|---|
| Meta Platforms Inc | 32.55 | 8.06 | 9.43 | 9.47% | $20.11 | $32.42 | 24.7% |
| Alphabet Inc | 24.61 | 6.26 | 5.91 | 7.43% | $26.04 | $48.73 | 13.49% |
| Baidu Inc | 17.95 | 1.11 | 2.07 | 2.79% | $9.03 | $18.15 | 5.86% |
| ZoomInfo Technologies Inc | 65 | 3.23 | 5.63 | -0.25% | $0.24 | $0.27 | 0.83% |
| Kanzhun Ltd | 82.36 | 3.45 | 8.85 | 3.23% | $0.26 | $1.34 | 36.32% |
| IAC Inc | 18.78 | 0.79 | 1.14 | 5.55% | $0.64 | $0.75 | -4.8% |
| Ziff Davis Inc | 67.70 | 1.73 | 2.31 | -1.69% | $0.03 | $0.29 | -0.26% |
| Yelp Inc | 35.23 | 4.11 | 2.48 | 8.04% | $0.06 | $0.32 | 11.73% |
| CarGurus Inc | 32.32 | 3.69 | 2.96 | 3.15% | $0.04 | $0.16 | -48.55% |
| Weibo Corp | 5.55 | 0.71 | 1.28 | 2.45% | $0.13 | $0.35 | -2.52% |
| Shutterstock Inc | 14.66 | 3.21 | 1.98 | 5.41% | $0.05 | $0.14 | 14.28% |
| Average | 36.42 | 2.83 | 3.46 | 3.61% | $3.65 | $7.05 | 2.64% |
When closely examining Meta Platforms, the following trends emerge:
-
A Price to Earnings ratio of 32.55 significantly below the industry average by 0.89x suggests undervaluation. This can make the stock appealing for those seeking growth.
-
It could be trading at a premium in relation to its book value, as indicated by its Price to Book ratio of 8.06 which exceeds the industry average by 2.85x.
-
With a relatively high Price to Sales ratio of 9.43, which is 2.73x the industry average, the stock might be considered overvalued based on sales performance.
-
With a Return on Equity (ROE) of 9.47% that is 5.86% above the industry average, it appears that the company exhibits efficient use of equity to generate profits.
-
The company has higher Earnings Before Interest, Taxes, Depreciation, and Amortization (EBITDA) of $20.11 Billion, which is 5.51x above the industry average, indicating stronger profitability and robust cash flow generation.
-
Compared to its industry, the company has higher gross profit of $32.42 Billion, which indicates 4.6x above the industry average, indicating stronger profitability and higher earnings from its core operations.
-
The company's revenue growth of 24.7% is notably higher compared to the industry average of 2.64%, showcasing exceptional sales performance and strong demand for its products or services.
Debt To Equity Ratio

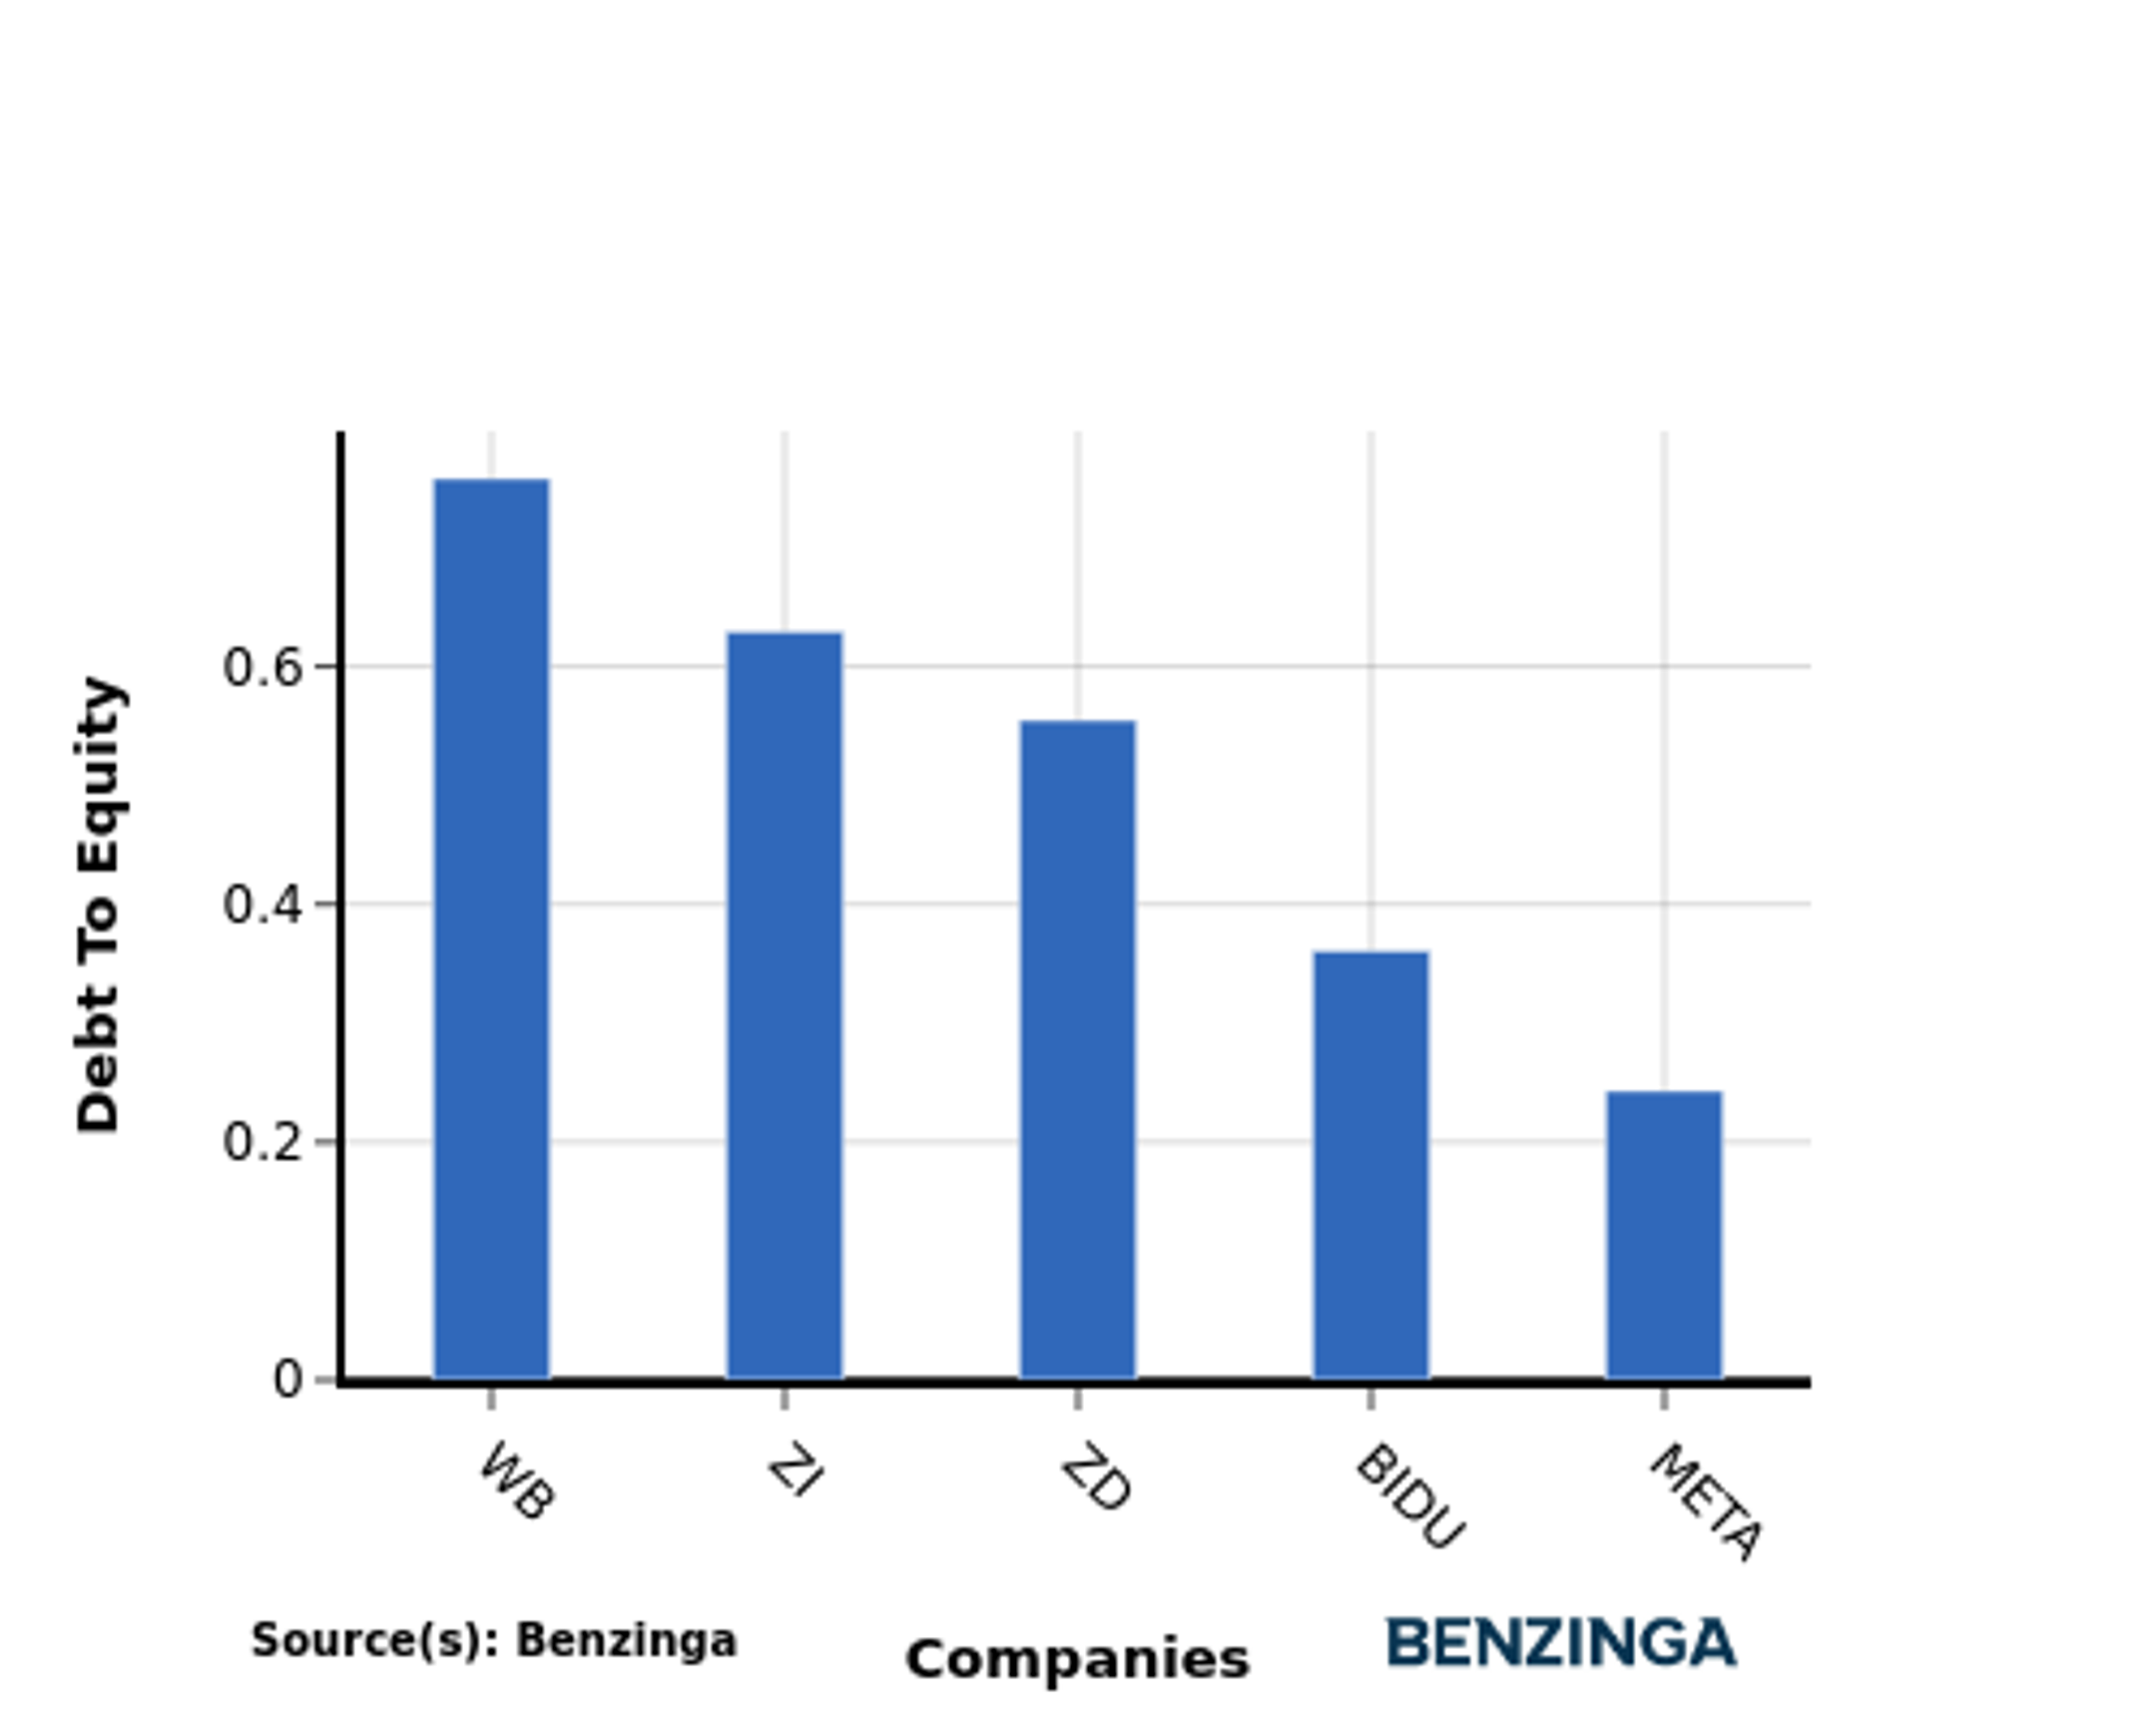
The debt-to-equity (D/E) ratio indicates the proportion of debt and equity used by a company to finance its assets and operations.
Considering the debt-to-equity ratio in industry comparisons allows for a concise evaluation of a company's financial health and risk profile, aiding in informed decision-making.
By evaluating Meta Platforms against its top 4 peers in terms of the Debt-to-Equity ratio, the following observations arise:
-
In terms of the debt-to-equity ratio, Meta Platforms has a lower level of debt compared to its top 4 peers, indicating a stronger financial position.
-
This implies that the company relies less on debt financing and has a more favorable balance between debt and equity with a lower debt-to-equity ratio of 0.24.
Key Takeaways
Meta Platforms has a low PE ratio compared to its peers in the Interactive Media & Services industry, indicating that it may be undervalued. The high PB and PS ratios suggest that the company's stock price and sales are relatively high compared to its book value and revenue. Meta Platforms has a high ROE, indicating efficient use of shareholder's equity. The company also has high EBITDA, gross profit, and revenue growth, indicating strong financial performance. Overall, Meta Platforms appears to be performing well compared to its industry peers based on these ratios.
This article was generated by Benzinga's automated content engine and reviewed by an editor.
© 2024 Benzinga.com. Benzinga does not provide investment advice. All rights reserved.
Trade confidently with insights and alerts from analyst ratings, free reports and breaking news that affects the stocks you care about.

