
It’s been one of those days. Stocks took it on the chin as the U.S. bond market flashed a signal for a potential recession, adding to investor worries stemming from disappointing economic data from China and Germany.
But these were just symptoms of a larger problem, as they all suggest global economic weakening stemming from the U.S.-China trade war that has already affected billions of dollars of global commerce and threatens to drag on despite yesterday’s small bit of relief.
After a brief but strong rally Tuesday on the announcement that the White House would delay the implementation of tariffs on some goods such as laptop computers and cell phones, the market plunged today as the yield on the 10-year Treasury slipped below that of the 2-year.
This so-called inversion has been a signal that has preceded most recessions since WWII, contributing to investor jitters as the heightened volatility that has plagued the market since last week continues. Wall Street’s main fear gauge, the Cboe Volatility Index (VIX), moved above 22, but investors perhaps found it comforting that it didn’t hit last week’s high above 24.
The ratcheted-up anxiety also followed German GDP data that showed Europe’s largest economy contracted by 0.1% during Q2. Also, official figures revealed Chinese industrial production slowed to the slowest rate since 2002 and retail sales growth there was below expectations.
Risk Appetite Switches Off
Investors have apparently flipped the risk-appetite switch to “off,” selling stocks and oil futures and looking for relatively safer assets. Among these, market participants bought gold futures, pushing the metal’s price on the futures market to its highest settlement since April 2013. (See figure 1 below).
Meanwhile, investors also bought U.S. government debt, which is also often seen as a safe haven amid market turmoil, and the 30-year Treasury fell to a record low.
Falling yields left bank shares vulnerable, and the Financials sector fell sharply. It can be harder for banks to earn money when they can’t charge as much interest on longer-term loans compared to the shorter-term rates they pay out to depositors.
The Energy sector was also particularly hard-hit as oil prices faltered on fears about demand as the global economy shows signs of weakening. A rise in U.S. inventories when analysts had been expecting a decrease also pressured oil.
Is It Really So Bad?
Although equity investors were running for the exits (or at least taking some money off the table), there may be a silver lining on the horizon. Amid the market turmoil, investors became more optimistic about a larger rate cut by the Fed next month, boosting the probability for a 50-basis-point cut to more than 25%.
It was also interesting to note that former Fed chief Janet Yellen told Fox Business Network that this time around the yield curve inversion “may be a less good signal” of a recession. “The reason for that is there are a number of factors other than market expectations about the future path of interest rates that are pushing down long-term yields,” she said.
As we’ve noted before the 2-year-10-year spread isn’t a perfect recession predictor, and much of the buying in the 10-year Treasury recently may be trade-based rather than solely from worry about the economy. Investors may also want to keep in mind that there tends to be a lag between an inversion and a recession, and during that time the market can actually gain ground.
In corporate news that didn’t help the dour mood, Macy’s (M) shares dropped more than 13% after the retailer reported earnings per share that came well short of the Street’s expectations, in another sign that stores that rely more heavily on foot-traffic may be struggling with the rise of online shopping. Same-store sales growth was also lower than forecast.
It may be worth noting that big moves such as today’s can be overdone. We’ll have to wait and see whether the market bounces back some.
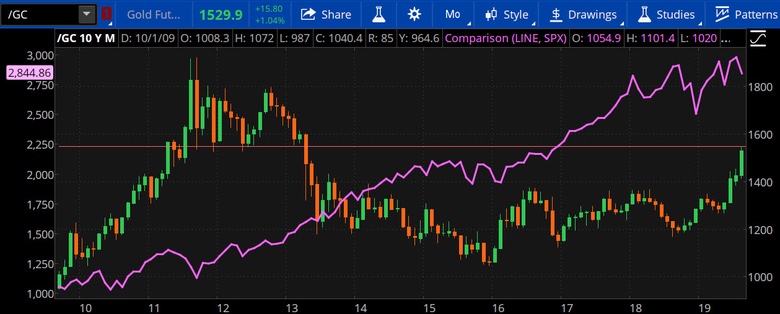
FIGURE 1: TAKING FLIGHT? While major stock indices such as the S&P 500 (SPX - purple line) have been receding from all-time highs after a multi-year run up, the gold market has seemingly hit its stride. You'd have to go back to April 2013 to see the last time gold futures (/GC - candlestick) traded in the mid-1,500s. Veteran traders will remember that was part of a 3-month slide that took gold from above $1,600 an ounce to below $1,200.Data source: S&P Dow Jones Indices, CME Group. Chart source: The thinkorswim® platform from TD Ameritrade. For illustrative purposes only. Past performance does not guarantee future results.
Information from TDA is not intended to be investment advice or construed as a recommendation or endorsement of any particular investment or investment strategy, and is for illustrative purposes only. Be sure to understand all risks involved with each strategy, including commission costs, before attempting to place any trade.
Image Sourced from Pixabay
© 2024 Benzinga.com. Benzinga does not provide investment advice. All rights reserved.
Comments
Trade confidently with insights and alerts from analyst ratings, free reports and breaking news that affects the stocks you care about.

