


With more and more trading platforms and the growing allure of low-to-no-fee brokerages, new traders are confronted with a deluge of options when it comes to trading and investing. But lost in the promises of sleek interfaces and free shares for signing up is the fact that successful trading takes time, practice and an understanding of resources experienced traders use on a daily basis.
With that in mind, we’re going to use this new series of articles to take a look at the charts, ratios and indicators that play an integral role in how traders generate ideas and form convictions on their medium- or short-term trades. To do that, we’ll be using the charts and tools available on the Webull trading app, which offers traders access to real, zero-commission trading in addition to a suite of advanced trading analysis and charting.
Fundamental information can be difficult to parse in some respects. While revenue numbers and per-share profits are clear enough indicators of how well a company has done in the previous quarter or fiscal year, new traders might glaze over other financial information included alongside those top- and bottom-line figures.
However, beyond the bare-bones sales numbers, there is useful information contained in those reports that can give traders an indication of the inner workings of a company and how well it is using the money it has to improve its performance for stakeholders.
Chief among these overlooked-yet-insightful financial statistics are those that have to do with a company’s cash flow. Cash flow is broadly used to denote the inflow and outflow of capital in various operations within a company. Because it offers a net picture of all of the money going into and out of a company, cash flow can provide investors a dynamic picture of how and when a company is choosing to spend or save its capital, and where it’s directing the money it has.
Cash flow is commonly broken into three separate segments: operating cash flow, investing cash flow and financing cash flow. Below are breakdowns of how each segment might be read to reflect a company’s spending strategy, using historical cash flow charts from the Webull trading platform.
Operating Cash Flow
While it might seem reductive to the other two segments, operating cash flow could arguably be considered the “primary” indication of capital performance since it reflects how money is spent and made in a business’ core operations. That, of course, includes revenue, but it also factors in the costs associated with those sales, like raw materials, vendor expenses, labor costs, even research and development. Essentially, any money that contributes to maintaining and improving a company’s ability to operate flows through this segment.
The chart below shows Google-parent-company Alphabet Inc. GOOG GOOGL annual operating cash flow over the past five years.
image courtesy of Webull
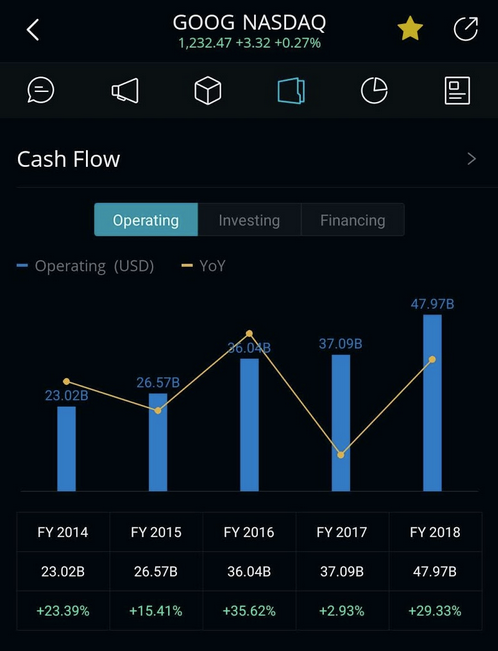
First, you can see the absolute amount of operating cash has only increased since 2014, as indicated by the blue bars. However, the rate of growth did slow in FY 2017, likely as a result of increased spending, since the company actually grew its revenue by 20% that year.
Google is an interesting example, since much of its revenue comes from selling targeted ad space, the value of which it generates through user data on its many free platforms (like Gmail and Google maps). As a result, having more cash flow might not necessarily be a good thing, since Google’s competitive edge is in developing new technologies.
On the other hand, the extra cash the company had on hand at the end of FY 2018 might also be a boon if its ad revenue fluctuates due to external conditions, such as increased federal scrutiny major tech companies have had relating to their business practices.
Obviously, different companies have different revenue models, which is why this kind of dynamic insight into how a company is spending or saving against its core business can add an extra dimension to more static revenue figures.
Investing Cash Flow
But the modern corporate landscape requires more than just the ability to sell a product or service. Companies need to be strategic about effectively allocating whatever extra capital it might have in the most efficient way possible.
That’s where investing cash flow comes in. This segment covers any capital spent or made on appreciative assets, anything that retains (or even increases in) value, like land and property or investment assets like stocks, bonds or any other kind of equity in another company.
Below is the annual investing cash flow chart for Verizon Communications Inc. VZ.
image courtesy of Webull
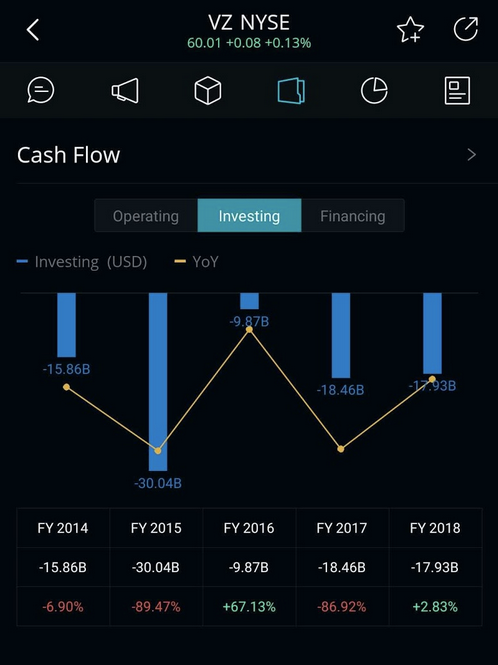
Keep in mind, that, because the money in this segment is spent on items that retain value, it’s common for investing cash flow to be negative. This is especially the case for communication companies like Verizon, which own vast plots of land and invest heavily in other companies in order to grow and develop.
That was the case for Verizon in 2015 when it made a major push to expand its coverage network. The result of this shows up not only in that year’s cash flow information but also in its 2016 share price.
Of course, not all investments are as immediately lucrative. Still being aware of who is spending and why can give traders better insight into what to expect of a company or industry in the coming months and years.
Financing Cash Flow
The final segment of the cash flow equation comes from how the company spends or generates money using its own equity. Essentially, financing cash flow is a reflection of how a business is leveraging itself to gain more outside investments, which potentially includes you.
So, any extra capital a company receives from traders and investors purchasing equity in the company will register in this segment. Financing cash flow also accounts for any dividend programs a company might have as well if the company decides to issue or buy back some of its shares.
Below is the chart for the annual financing cash flow for Pfizer Inc. PFE.
image courtesy of Webull
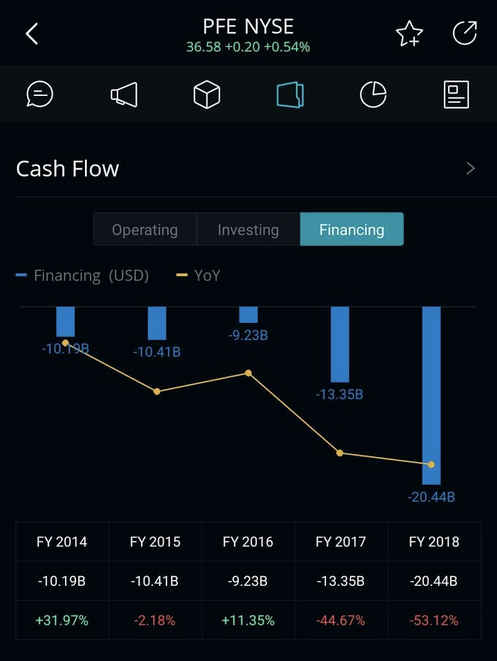
Like investing cash flow, financing is often done for the promise of realizing higher returns in the future. This strategy was especially popular in 2018 thanks to changes to the corporate tax code in the previous year. A result of the newly freed-up capital was a flood of stock buybacks from companies looking to quickly increase the value of their equity.
Pharmaceutical companies like Pfizer were particularly eager to use their tax windfall, engaging in record stock buybacks and increasing their dividend programs by as much as 4%.
Although financing information like this can prove to be a huge benefit in the short-term, traders should also be aware that companies sometimes use these tools to artificially increase the appeal of their stock. While there's nothing wrong with sharing the benefits of a successful business, incentives like buybacks and dividends can backfire on investors who don’t also consider a company’s fundamental strength to back them up in the long-term.
For its part, Pfizer is trading near 52-week lows following a disappointing earnings delivery and lowered fiscal year guidance.
Weibull is a content partner of Benzinga
Edge Rankings
Price Trend
© 2025 Benzinga.com. Benzinga does not provide investment advice. All rights reserved.

