


The Financials sector ranks tenth out of the ten sectors as detailed in my Sector Rankings for ETFs and Mutual Funds report. It gets my Very Dangerous rating, which is based on aggregation of ratings of 46 ETFs and 227 mutual funds in the Financials sector as of January 30, 2013. Prior reports on the best & worst ETFs and mutual funds in every sector and style are here.
Figures 1 and 2 show the five best and worst-rated ETFs and mutual funds in the sector. Not all Financials sector ETFs and mutual funds are created the same. The number of holdings varies widely (from 23 to 519), which creates drastically different investment implications and ratings. The best ETFs and mutual funds allocate more value to Attractive-or-better-rated stocks than the worst ETFs and mutual funds, which allocate too much value to Neutral-or-worse-rated stocks.
To identify the best and avoid the worst ETFs and mutual funds within the Financials sector, investors need a predictive rating based on (1) stocks ratings of the holdings and (2) the all-in expenses of each ETF and mutual fund. Investors need not rely on backward-looking ratings. My fund rating methodology is detailed here.
Investors should not buy any Financials ETFs or mutual funds because none get an Attractive-or-better rating. If you must have exposure to this sector, you should buy a basket of Attractive-or-better rated stocks and avoid paying undeserved fund fees. Active management has a long history of not paying off.
Get my ratings on all ETFs and mutual funds in this sector on my free mutual fund and ETF screener.
Figure 1: ETFs with the Best & Worst Ratings – Top 5

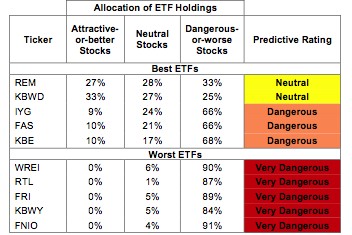
Sources: New Constructs, LLC and company filings
Four ETF’s are excluded from Figure 1 because their total net assets (TNA) are below $100 million and do not meet our liquidity standards.
Figure 2: Mutual Funds with the Best & Worst Ratings – Top 5

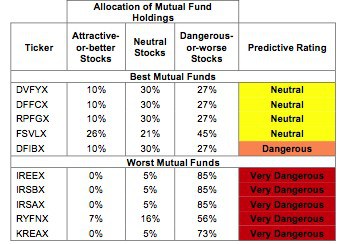
Sources: New Constructs, LLC and company filings
ICON Funds: ICON Financial Fund (ICFSX) is excluded from Figure 2 because its total net assets (TNA) are below $100 million and do not meet our liquidity standards.
iShares FTSE NAREIT Mortgage REITs Index Fund REM is my top-rated Financials ETF and Davis Series, Inc: Davis Financial Fund DVFYX is my top-rated Financials mutual fund. Both earn my Neutral rating.
iShares FTSE NAREIT Industrial/Office Capped Index Fund FNIO is my worst-rated Financials ETF and Forward Funds: Forward Real Estate Fund KREAX is my worst-rated Financials mutual fund. Both earn my Very Dangerous rating.
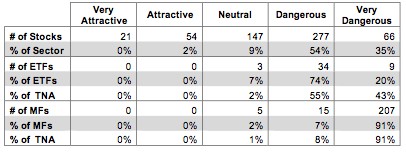
Figure 3 shows that 75 out of the 565 stocks (over 2% of the total net assets) held by Financials ETFs and mutual funds get an Attractive-or-better rating. However, no Financials ETFs and no Financials mutual get an Attractive-or-better rating.
The takeaways are: mutual fund managers allocate too much capital to low-quality stocks and Financials ETFs hold poor quality stocks. Investors can get higher returns for lower costs by investing in the right individual stocks in this sector.
Figure 3: Financials Sector Landscape For ETFs, Mutual Funds & Stocks

As detailed in “Cheap Funds Dupe Investors”, the fund industry offers many cheap funds but very few funds with high-quality stocks, or with what I call good portfolio management.
Investors need to tread carefully when considering Financials ETFs and mutual funds, as no ETFs or mutual funds in the Financials sector allocate enough value to Attractive-or-better-rated stocks to earn an Attractive rating. Investors should focus on individual stocks instead.
The Progressive Corp PGR is one of my favorite stocks held by Financials ETFs and mutual funds and earns my Very Attractive rating. PGR boasts a top quintile ROIC of 19% and rising economic earningsalong with a 9% free cash flow yield. At ~$22.5/share, PGR trades at a price to economic book value ratioof 1.0. This valuation implies that PGR will never grow NOPAT from its current level. Expecting zero growth from a company that has grown NOPAT at 7% compounded annually since 1998 seems overly pessimistic.
Citigroup Inc. C is one of my least favorite stocks held by Financials ETFs and mutual funds and earns my Very Dangerous rating. Citigroup is an example of how GAAP net income can be misleading. Citigroup’s GAAP net income rebounded after the financial crisis and managed a slight growth of 3.3% last year. The company’s true after-tax cash flow (NOPAT), on the other hand, declined by a whopping 71% last year. Citigroup’s share price of ~$42 implies that the company will rebound and grow NOPAT by 29% compounded annually for the next eight years. Such a turnaround would be awfully impressive, but investors would not be wise to bet that the company will meet or exceed those expectations, which is exactly what they are doing by owning the stock.
589 stocks of the 3000+ I cover are classified as Financials stocks.
Figures 4 and 5 show the rating landscape of all Financials ETFs and mutual funds.
Our Sector Rankings for ETFs and Mutual Funds report ranks all sectors and highlights those that offer the best investments.
Figure 4: Separating the Best ETFs From the Worst ETFs

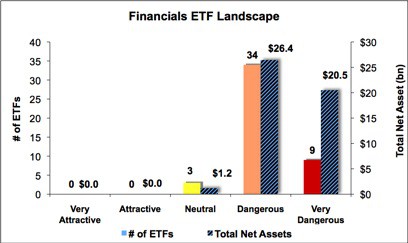
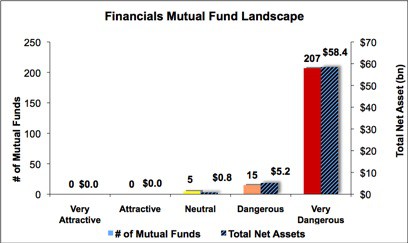
Figure 5: Separating the Best Mutual Funds From the Worst Mutual Funds
Review my full list of ratings and rankings along with reports on all 46 ETFs and 227 mutual funds in the Financials sector.
Sam McBride contributed to this report.
Disclosure: David Trainer and Sam McBride receive no compensation to write about any specific stock, sector or theme.
© 2024 Benzinga.com. Benzinga does not provide investment advice. All rights reserved.
Trade confidently with insights and alerts from analyst ratings, free reports and breaking news that affects the stocks you care about.

