


After a brief bout of the yips that lasted from August to early October, the S&P 500 is once again close to hitting a new all-time high.
New highs on their own are never a bad thing, and short periods of volatility are common, but the question now becomes whether those highs can be sustained. Because that’s been a difficult proposition over the past year.
The S&P’s most recent high, which occurred back in July, was the third time in the past 52 weeks that the index has surpassed a previous high, only to fall by at least 7% the intervening weeks and/or months.
But it’s not as if the new highs resulted in dramatic new highs. The last two all-time highs in the S&P 500—set in April and July of this year—have only exceeded their previous peaks by less than 3% before plunging again. This pattern extends all the way back to early 2018, which saw a massive sell-off over the course of February following 2017’s extended bull run.
More interesting is that these new all-time highs have also been accompanied by multi-year highs in gold, which typically doesn’t have a positive correlation with stocks since gold is a popular safety investment when stocks do poorly.
Because both equities and precious metals are breeching rarified territory, ETFs that cover the broad market and precious metals industries have seen an uptick in volatility and attention. The comparison chart for the Direxion Daily S&P 500 Bull 3X Shares SPXL and the Direxion Daily Gold Miners Index Bull 3X Shares NUGT.
Chart via Yahoo Finance. Data as of Oct 22, 2019. Past performance is not indicative of future results. Investment return and principal value of an investment will fluctuate so that an investor's shares, when redeemed, may be worth more or less than their original cost. Current performance may be lower or higher than the performance data quoted. For standardized performance, click here.
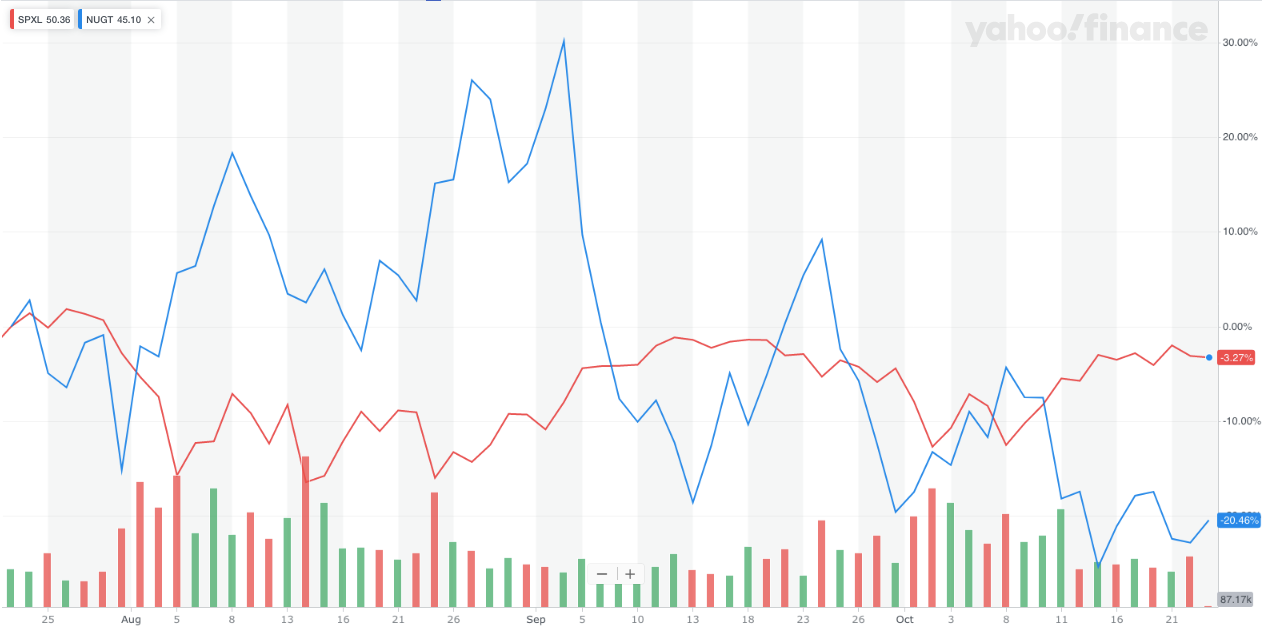
Regardless of the high valuation in both gold and equities, the inverse relationship between the two can still be seen in the chart above, with gold posting gains while stocks fall, and gold dipping back down as stocks rebound.
While that snapshot of gold and equity shows an interesting picture of the dueling markets, traders now need to ask: what comes next? With both equities and gold having reversed their most recent trend, history suggests that one side is going to break first. Either money will flow out of equities, or gold will ratchet down from the highs it’s maintained August.
For some insight, fund flow data for the ETFs can provide some clues as to how traders are approaching this current inflection point and observe how traders in SPXL and NUGT have played prior reversals.
Chart via ETF.com. Data as of Sept 22, 2019, Past performance is not indicative of future results. Investment return and principal value of an investment will fluctuate so that an investor's shares, when redeemed, may be worth more or less than their original cost. Current performance may be lower or higher than the performance data quoted. For standardized performance, click here.
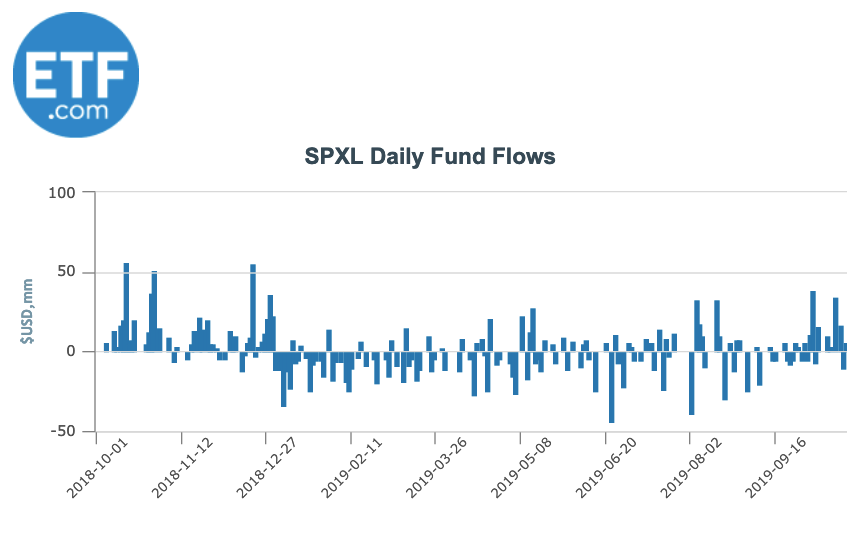
With respect to SPXL, the current trend shows redemptions outpacing creations over the past year by about $53 million in outflows. However, inflow over the last three months has been in the positive by roughly $70 million. This trend implies that while traders have been less-inclined to actively trade the dip since July’s peak, they are increasingly eager to test a potential new high here in the fourth quarter.
NUGT, on the other hand, has seen $117 million in inflows since mid-July, a massive reversal from the previous 12 months that showed $833 in redemptions of the ETF. This implies traders are still positioning themselves to be bullish gold, or at least more willing to trade gold at its current levels.
Chart via ETF.com. Data as of October 22, 2019, Past performance is not indicative of future results. Investment return and principal value of an investment will fluctuate so that an investor's shares, when redeemed, may be worth more or less than their original cost. Current performance may be lower or higher than the performance data quoted. For standardized performance, click here.
However, one area of concern traders should consider when looking at the fund flow for NUGT are the points at which outflows spiked, specifically during February and at several points in June. These redemptions were the result of steep jumps in the price of gold but were followed by several weeks of volatile moves in both gold and NUGT.
What’s more, these periods also happened to coincide with new highs in the S&P 500. So, while traders seem eager to buy the dip in NUGT, SPXL has momentum and history on its side—for the time being, at least.
Investing in a Direxion Shares ETF may be more volatile than investing in broadly diversified funds. The use of leverage by a Fund increases the risk to the Fund. The Direxion Shares ETFs are not suitable for all investors and should be utilized only by sophisticated investors who understand leverage risk, consequences of seeking daily leveraged, or daily inverse leveraged, investment results and intend to actively monitor and manage their investment.
An investor should carefully consider a Fund’s investment objective, risks, charges, and expenses before investing. A Fund’s prospectus and summary prospectus contain this and other information about the Direxion Shares. To obtain a Fund’s prospectus and summary prospectus call 866-476-7523 or visit our website at direxion.com. A Fund’s prospectus and summary prospectus should be read carefully before investing.
Shares of the Direxion Shares are bought and sold at market price (not NAV) and are not individually redeemed from a Fund. Market Price returns are based upon the midpoint of the bid/ask spread at 4:00 pm EST (when NAV is normally calculated) and do not represent the returns you would receive if you traded shares at other times. Brokerage commissions will reduce returns. Fund returns assume that dividends and capital gains distributions have been reinvested in the Fund at NAV. Some performance results reflect expense reimbursements or recoupments and fee waivers in effect during certain periods shown. Absent these reimbursements or recoupments and fee waivers, results would have been less favorable.
Direxion Shares Risks - An investment in the ETFs involves risk, including the possible loss of principal. The ETFs are non-diversified and include risks associated with concentration that results from an ETF’s investments in a particular industry or sector which can increase volatility. The use of derivatives such as futures contracts and swaps are subject to market risks that may cause their price to fluctuate over time. The ETFs do not attempt to, and should not be expected to, provide returns which are a multiple of the return of their respective index for periods other than a single day. For other risks including leverage, correlation, daily compounding, market volatility and risks specific to an industry or sector, please read the prospectus.
Distributor: Foreside Fund Services, LLC.
© 2024 Benzinga.com. Benzinga does not provide investment advice. All rights reserved.
Trade confidently with insights and alerts from analyst ratings, free reports and breaking news that affects the stocks you care about.

