


In studying Forex trading, you may come across the term "pivot points." Pivot points are a collection of support and resistance markers that are calculated to give you an idea of where to buy and sell a currency pair. Pivot points aren't solely used in Forex, their history begins in the futures pits and harken back to the days of open outcry trading, and pre-computer days.
Unlike many other indicators, pivot points are predictive by their very nature. Essentially, they identify where the overall pivot in the market might be, and then the next three support and resistance levels. This indicator is quite powerful, but like many other indicators should be confirmed by either price action or other factors like a previous support level.
The study of pivot points focuses on the relationships between the high, low and closing prices between each trading day. In other words, the previous trading day's prices are used to calculate the pivot point for the current day. The pivot point itself, the central focus of the indicator, is considered to be "fair value" for the market going into the session. If price is rising and has turned around, it is said to have run into resistance. Alternately, if price is falling and has turned around, it is said to have met support. This indicator will plot out what the "fair value" of the market is, and then three potential areas in both directions called support one, support two, support three, and alternately resistance one, resistance two, and resistance three to act as guidelines.
The Calculation
The calculation for the pivot point of the day is equal to the average of the previous session's high, low and closing prices. By knowing the pivot point, then you can extrapolate S1, S2, S3, R1, R2, and R3.
The rest of the pivot points can be calculated as following:
- Resistance 1 = (2 x Pivot Point) – Low (previous period)
- Support 1 = (2 x Pivot Point) – High (previous period)
- Resistance 2 = (Pivot Point – Support 1) + Resistance 1
- Support 2 = Pivot Point – (Resistance 1 – Support 1)
- Resistance 3 = (Pivot Point – Support 2) + Resistance 2
- Support 3 = Pivot Point – (Resistance 2 – Support 2)
Statistical Probabilities
One of the main reasons that traders use pivot points is that statistically, they have worked out. For example, the EUR/USD pair has printed a low for the day under S1 roughly 44 percent of the time. The high of the day has been above R1 roughly 42 percent of the time, while the low has been lower than S2 merely 17 percent of the time. Going forward, R2 has been breached by the highs of the day only 17 percent of the time, while the lows and highs breaking above or below S3 and R3 only occurs roughly 3 percent of the time. Because of this, you can get a feel for how likely price is to go to one of these areas. The concept is similar to a bell curve and standard deviations. Beyond two standard deviations, it's very rare that you stay there.
Think of it this way: if the R1 level is only broken above roughly 42 percent of the time, then that means that if you are short of the market, the odds are on your side if you put the stop loss above resistance one. Obviously, there's an entire combination and a plethora of possibilities here.
Luckily, most trading platforms now include pivot points, so you won't necessarily need to know how to do the calculations.
An Example In Action
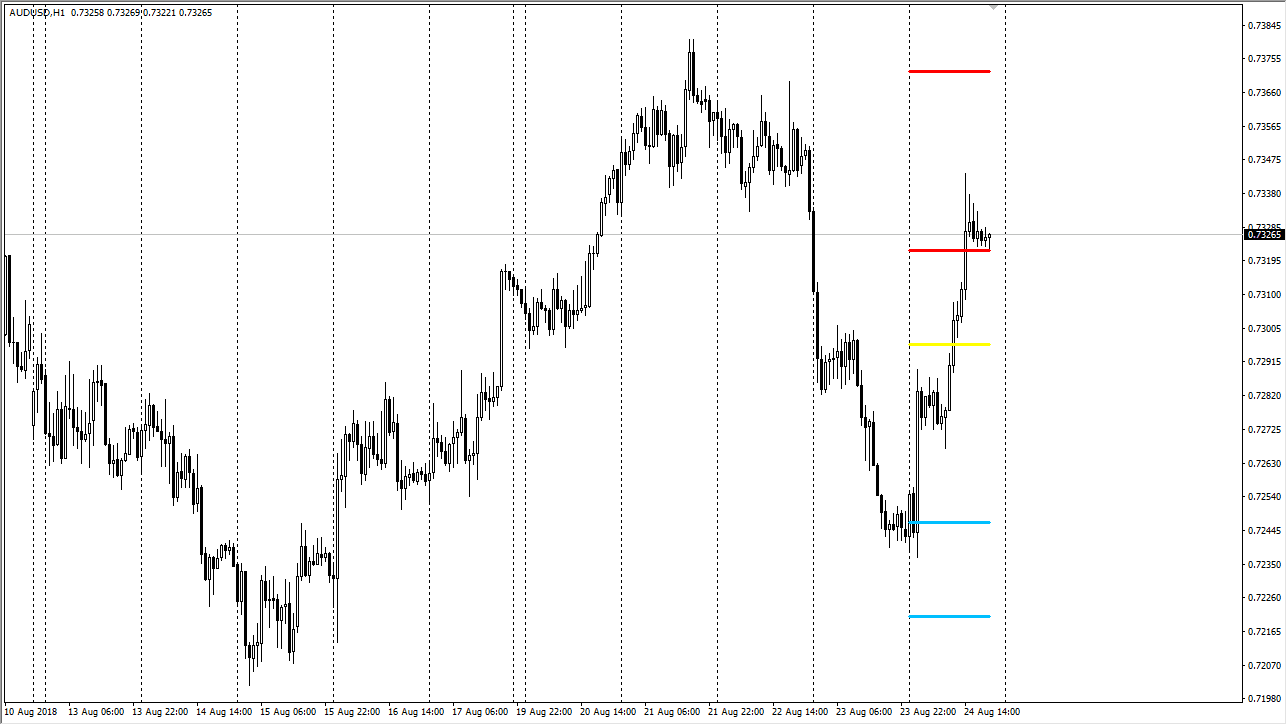
The AUD/USD pair shown below has a pivot point indicator attached to it. In this particular set up, the pivot point from the previous day is the yellow line, while the support levels are blue, and the resistance levels are red. Notice that the market started the day much lower than the pivot. The central pivot line, the yellow line, should be thought of as potential "fair value" for the market. Instead of starting there, it started at S1, and started seeing support. You can see clearly that we initially moved towards the pivot point, but then broke higher. You will notice that we stalled at R1, where we closed the day.
These levels are important because even when they are broken, the next level will start to show its influence. Left to be pointed out about the chart is that the central pivot is at the 0.73 level, an area that has been both support and resistance more than once. That is why is not a huge surprise to see that the market slammed into that level and did not break through it right away. If you had decided to go long of the market based upon S1, you probably would have taken profit near the pivot point. Beyond that, if we break out to the upside as happened, then you could very well look to the area just below the pivot point to place a stop loss. While not a trading system in-and-of-itself, pivot points do work on statistical probability, which much of quantitative trading is based on. Keep in mind that a lot of machines are trading currencies these days, so these ratios and formulas certainly can come into play.
Pivot points are typically used for shorter-term trading, but there are pivot points out there that are used for monthly time frames as well. When calculating those, simply replace the high, low, close values of the previous session with the previous month. It works the same way, in any timeframe.
Related Links:
Podcast: How Leveraged ETF's Work, And What's Hot Now
This Technical Analyst Expects Amazon's Stock To Make A U-Turn
© 2024 Benzinga.com. Benzinga does not provide investment advice. All rights reserved.
Trade confidently with insights and alerts from analyst ratings, free reports and breaking news that affects the stocks you care about.

