


The USD/JPY pair is losing altitude for the fourth straight day, now trading just below the monthly 200-MA level of 105.71. The currency pair is down 6.9 percent from the January high of 113.39.
The Bank of Japan (BOJ) and the Japanese government is comfortable with the sharp appreciation of Yen exchange rate, indicate Aso's comments. Further, investors fear the Fed may have to normalize the policy at a faster rate in response to rising price pressures, and that could lead to a hard landing. The list of dollar bearish factors also includes fiscal profligacy, twin deficits, rising threat of a trade war.
Thus, USD/JPY could extend the slide to 103.00-102.00 levels as discussed in January. A long-run bearish breakdown on the charts also looks like a done deal.
Monthly chart
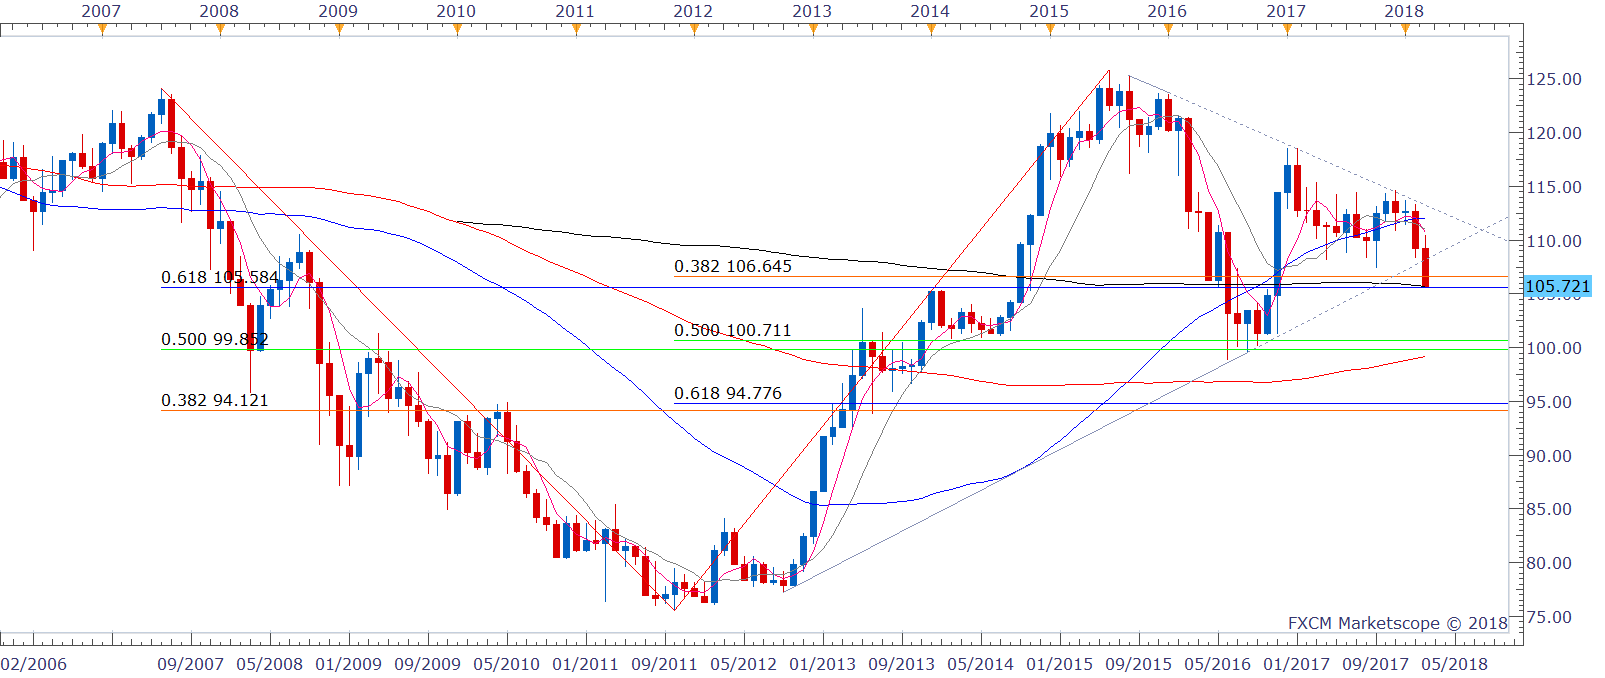
The support of the trendline sloping upward from the September 2012 low and August 2016 low has been breached. The trendline will likely offer resistance at 108.00 (former support).
A monthly close (Feb. 28 close) below 108.00 looks like a done deal and would signal bearish symmetrical triangle breakdown. So, the spot could extend the decline to 103.00-100.00 levels over this year.
That said, in the short-run a minor technical correction cannot be ruled out, courtesy of the oversold conditions.
The relative strength index (RSI) shows oversold conditions on the daily and 4-hour chart. Meanwhile, the JPY risk reversals have retraced bullish bias in the last few days. The weekly 25-delta risk reversals are now being paid at 1.825 JPY calls vs. 2.50 JPY calls on Feb. 6 (indicates JPY call premium has dropped = retracted bullish bias). On similar lines, one-month 25 delta risk reversals are being paid at 2.175 JPY calls vs. 2.425 JPY calls.
View
- On a larger scheme of things, the pair looks set to test 103.00-102.00.
- A minor corrective rally could be seen, but is likely to be capped around the downward sloping 1-hour 50-MA currently positioned at 106.69.
- The momentum studies on the daily chart are biased bearish - the 5-day MA and 10-day MA are trending lower. So upticks above 107.00 are likely to be short-lived.
- Only a weekly close above 108.00 would signal bearish invalidation.
© 2024 Benzinga.com. Benzinga does not provide investment advice. All rights reserved.
Trade confidently with insights and alerts from analyst ratings, free reports and breaking news that affects the stocks you care about.

