
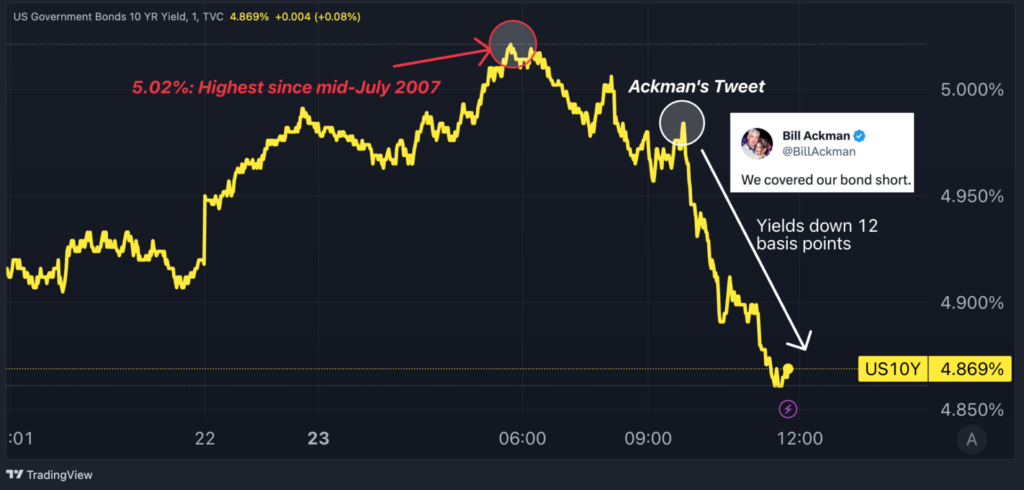
It’s another day of intense fluctuations in Treasury bond yields, with particular attention focused on the 10-year Treasury yield.
At the start of the week, this crucial benchmark broke through a significant psychological barrier, surging to 5.02%, its highest level since mid-July 2007.
However, this milestone triggered a wave of Treasury purchases, causing yields to retreat to 4.87% by the time of this writing.
Among today’s buyers, one prominent figure stood out—a trader who had previously been a steadfast seller of Treasury bonds: Bill Ackman.
Chart: 10-year Yields Price Action On Oct. 23

Why Is Bill Ackman Covering His Treasury Shorts?
Ackman made a bold move in early August by taking a short position on long-term Treasury securities. His bet was rooted in the belief that mounting deficits, rising inflation, and escalating geopolitical tensions would lead to an increase in yields.
The exact size of Ackman’s wager remains undisclosed, but the results thus far have favored his position. Since initiating his bet, Ackman has witnessed the iShares Treasury 20+ Year ETF (NASDAQ:TLT), a proxy for the long end of the Treasury yield curve, fall by approximately 12%.
On Oct. 23, the renowned investor took to social media, specifically Elon Musk‘s platform X, to announce his decision to cover his Treasury shorts.
Ackman cited the reason as “the economy is slowing faster than recent data suggests” and expressed his view that “there is too much risk in the world to remain short bonds at current long-term rates.”
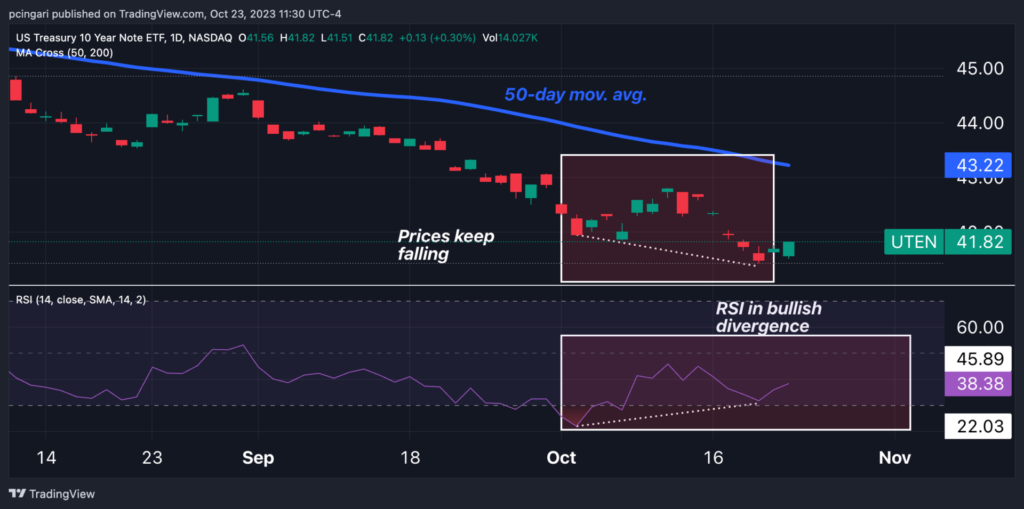
Technical Indicators Suggest Bears Are Losing Steam
While it’s too early to definitively declare a trend reversal in the Treasury bond market, some technical indicators suggest a potential weakening of seller momentum.
The Relative Strength Index (RSI), calculated on the daily chart of the US Treasury 10 Year Note ETF (NYSE:UTEN), is showing an upward trend, exiting the oversold zone.
Interestingly, this divergence is occurring despite the price chart displaying a different picture—prices continue to trend downward, reaching new lows in recent sessions.
This bullish RSI divergence in the price of the 10-year Treasury bond could be a precursor to the start of a new uptrend, but only time will tell.
Chart: US Treasury 10 Year Note ETF Forms Bullish RSI Divergence

Read now: S&P 500 Breaches 200-Day Average As Treasury Yields Hit 5%: Analyst Says The Primary Trend Is ‘Down’
Image created using artificial intelligence with MidJourney.
© 2025 Benzinga.com. Benzinga does not provide investment advice. All rights reserved.