


Headlines This Past Week
NFP: The latest U.S. nonfarm payrolls report showed the unemployment rate ticked higher to 3.8% in August, reaching its highest level in more than a year. Economists had expected it to remain at 3.5%.
In another sign of a slowing economy and easing pricing pressures, average hourly earnings increased 4.3% on a year-over-year basis, less than the 4.4% increase expected by economists polled by Dow Jones.
August payrolls grew at a faster-than-expected pace, with 187,000 being added. However, job numbers first reported for June and July were revised down by a combined 110,000.
JOLTs: The number of job openings edged down to 8.8 million in July, dropping from 9.58 million in June, reported the U.S. Bureau of Labor Statistics in its monthly Job Openings and Labor Turnover Survey. Quits also declined 3.5 million, while layoffs and discharges slightly fell to 1.6 million.
We refer back to this SPDR S&P 500 SPY chart that we’ve been tracking since beginning of the year. $SPY 4HTF. Initially our “LOW” call, was 440/443 range which was the breakout area in July, which should have turned support. We know that this range was held for about 4 days back in August but finally did break down and hit 434 at August 18th lows. For now, we remain steadfast that the lows experienced on August 18, was the bottom. While we backtested late August to test the lows, velocity we saw this week back above 443 and beyond is quite convincing that investors are buying the dips.


There are a few reasons we feel this was the low and we are about to test new yearly highs:
- Inflation trending in the right direction. Next headline CPI release is Sept 13. Energy Food Transportation does remain volatile, and given summer oil prices we could see elevated inflation print. But overall we are in the right direction.
- Unexpected Unemployment Rate rise is showing signs that Fed’s hiking campaign is working and thus we believe FOMC will Pause in September.
- We closed the month of August with continuing MACD, bullish turn. All in all, given the recover in the last week of August, in greater context of the trend, does not spell bearish.


Bullish MACD on the move. Hammer august month.


$S5FI - % of Stocks above 50Day MA - Very favorable bounce fro the lows in August reaffirms our outlook:


Fun Fact: S&P 500, Nasdaq, and Dow Jones all reclaimed their 50D moving averages just as stocks are entering the worst month. Although September is historically the worst month on average, when the VIX fell under 14 in August, stocks finished September higher almost 90% of the time.
Most of Wall Street is calling for a very bearish September. But what does actual data suggest?
$SPX SPDR S&P 500 SPY the last 14 times when index is up more than 10% through July with 0 or Negative return % in August, index rose 100% of the time with a median of 8.7% return. At the low end of spectrum if SPX rose even 3.0% as such in 1967, that would place index 4650s. That would be around March 2022 highs and new 52 week high. (CREDIT: Ned Davis Research)


Short term, we are expecting some choppy waters as markets determine direction. The immediate support we are looking at is 5DMA at 448, and 50DMA at 446. Remember that pullbacks are healthy and may need to backtest. If we look at what happened back in March lows and December 2022 lows, prices can breakout above the 20d/50d, but usually comes back at some point to retest support. If no major bad news, dips are buyable in these areas as market consolidates from a strong week caused by jobs data. MACD has turned bullish crossover for the time being and the setup looks more like March 2023 lows. This week if 450 holds, we want to see the 455 daily gap get filled.


Invesco QQQ Trust QQQ
Winning week on the Nasdaq Index as we saw $AAPL $TSLA $NVDA continue to bounce from August lows. Immediate support at 5DMA 374.79 for the moment. Bears were hammering the Head And Shoulders pattern after $NVDA earnings and while it did pan out for a day, The index has also moved above the 50DMA/20DMA. The 50D is at the 371 level and we also saw 380 handsomely rejected this week. As I say, every level every devil. As long as prices cruise above the 5DMA + 50DMA no worries here on buying the dips in tech.

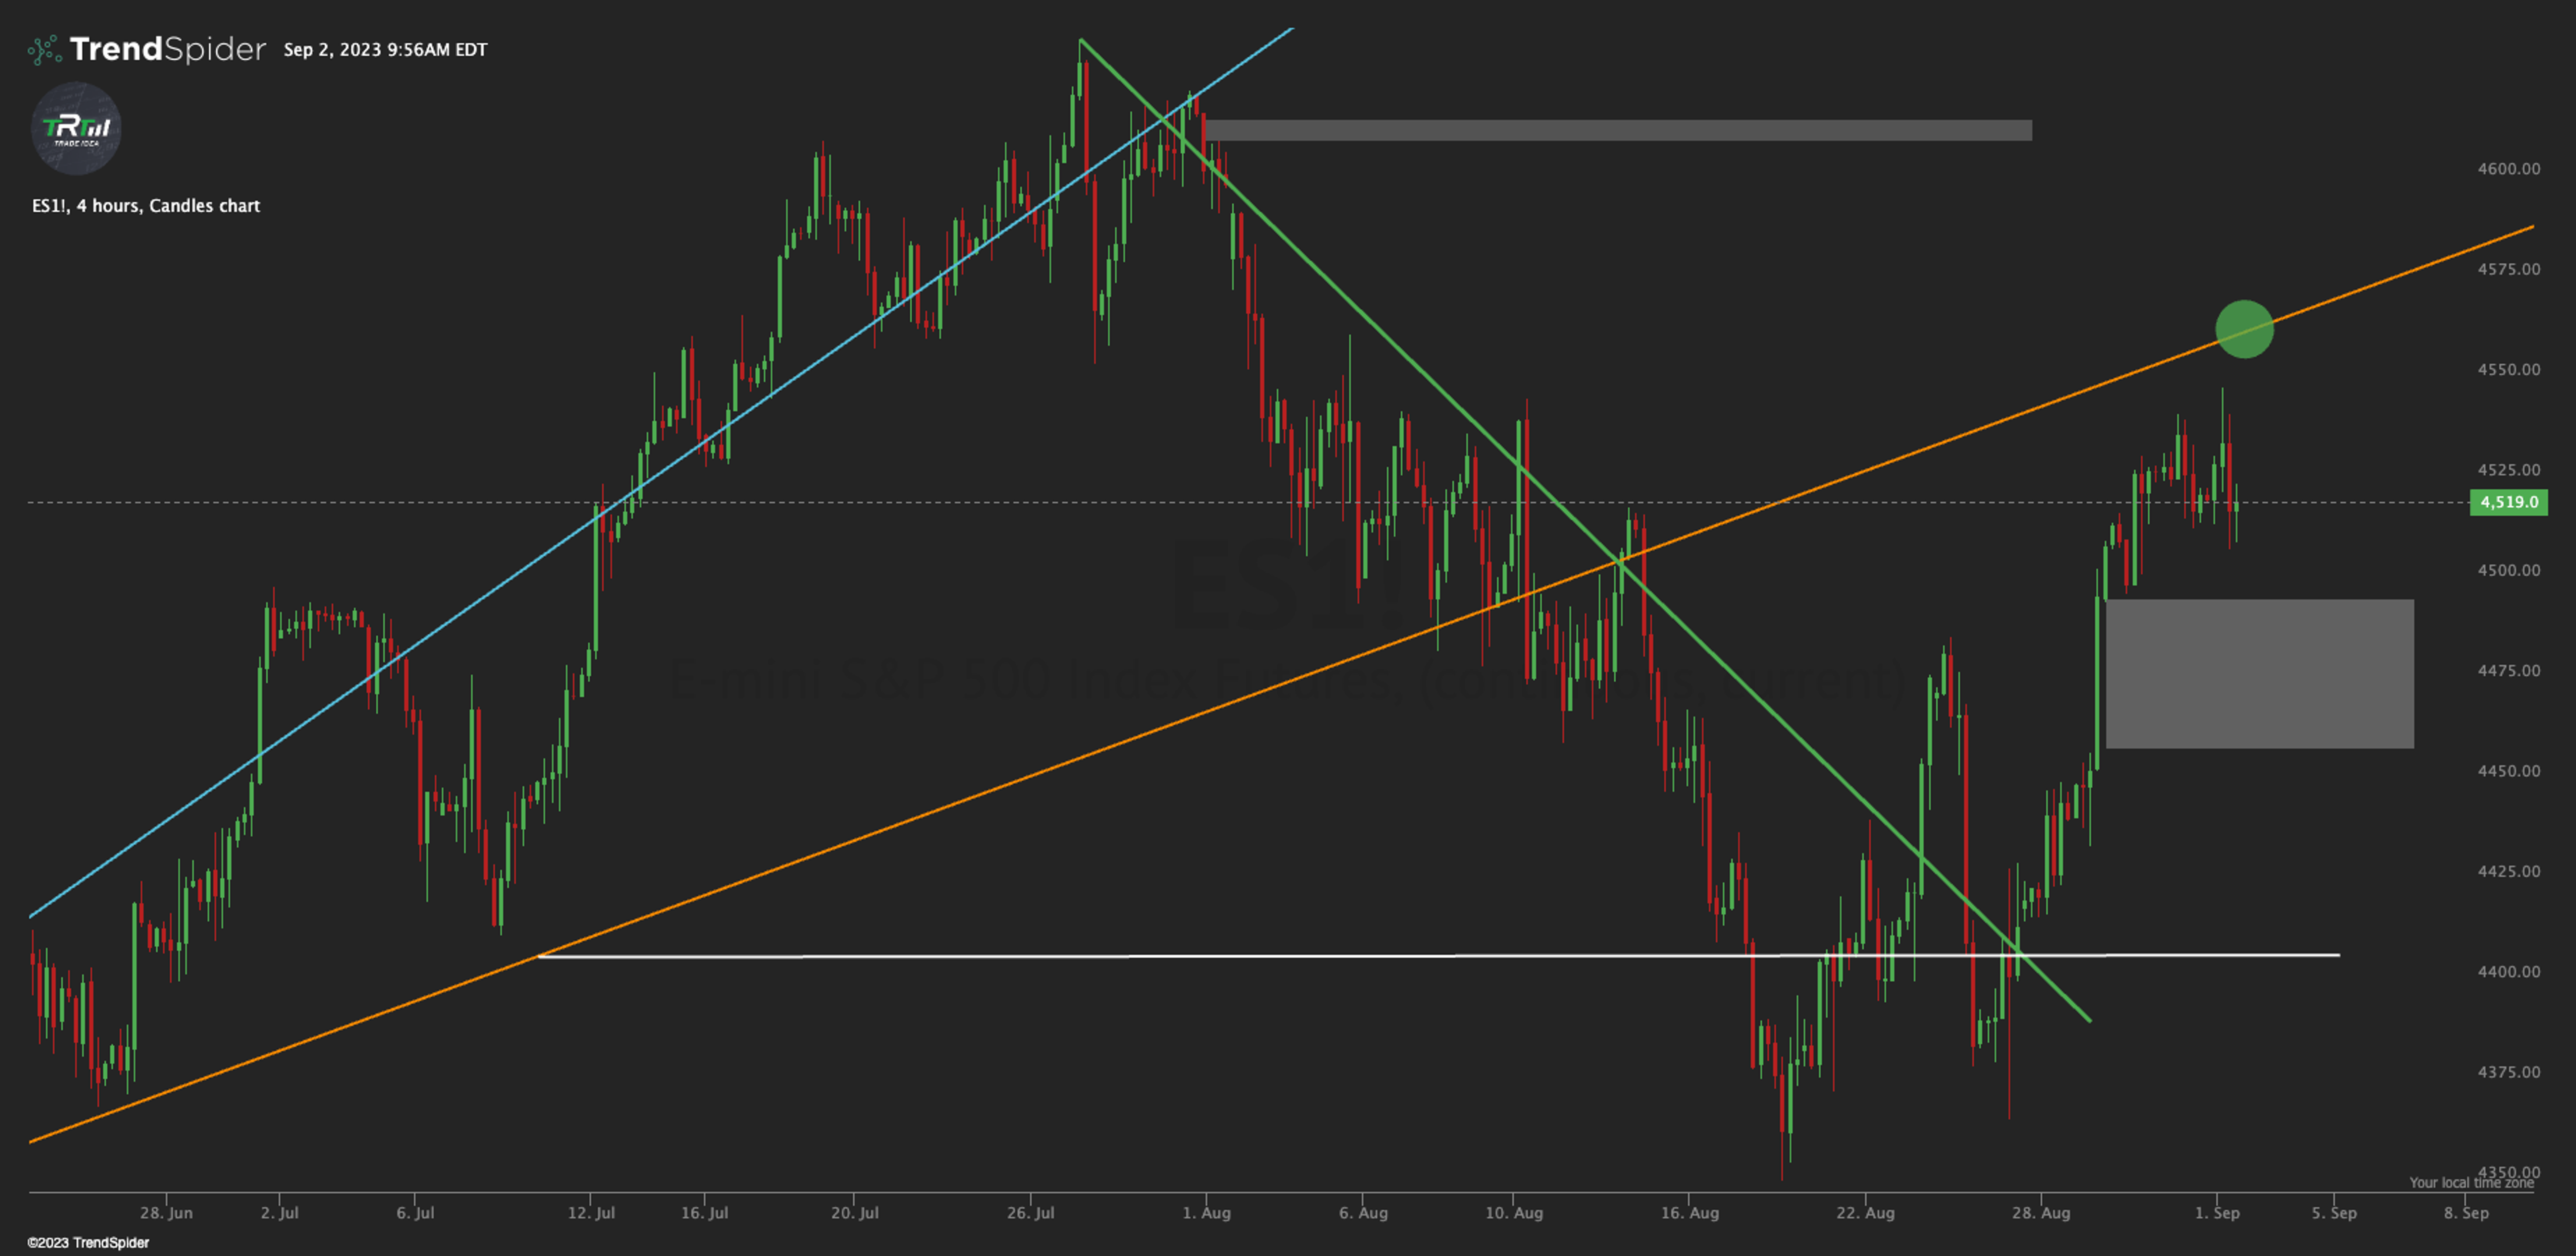
S&P 500 Mini Futures
Perhaps the most obvious view of August 18th was the “lows”. And August 28th was a successful retest before breaking out back to the upside trapping bears on this look. We are sticking with our target of 4550s, on this impulse move before coming back down towards 4500 for a backtest.
To get the rest of our watch list on tech stocks such as Amazon AMZN, Advanced Micro Devices AMD, Tesla, Inc TSLA, Apple, Inc AAPL message me here.
We have also a great community of traders around quities and futures, you can join us @ therocktradingco.com for daily insights and trading.
Edge Rankings
Price Trend
© 2025 Benzinga.com. Benzinga does not provide investment advice. All rights reserved.
Trade confidently with insights and alerts from analyst ratings, free reports and breaking news that affects the stocks you care about.

