


Subscribe to Trading Adventures and follow on Twitter/X for more charts and comments.
The Markets
The seasonal, summer selloff is right on time. In fact, it has followed the schedule perfectly up to this point. In a mid-July article titled, Pumping The Brakes, this was shared -
In the near term, there is a seasonal tendency for a decline over the next two to four weeks. Today’s charts indicate the potential beginning of that decline.
This is week four since that was written.
Right on time.
Now what?
Is it time to buy the dip?
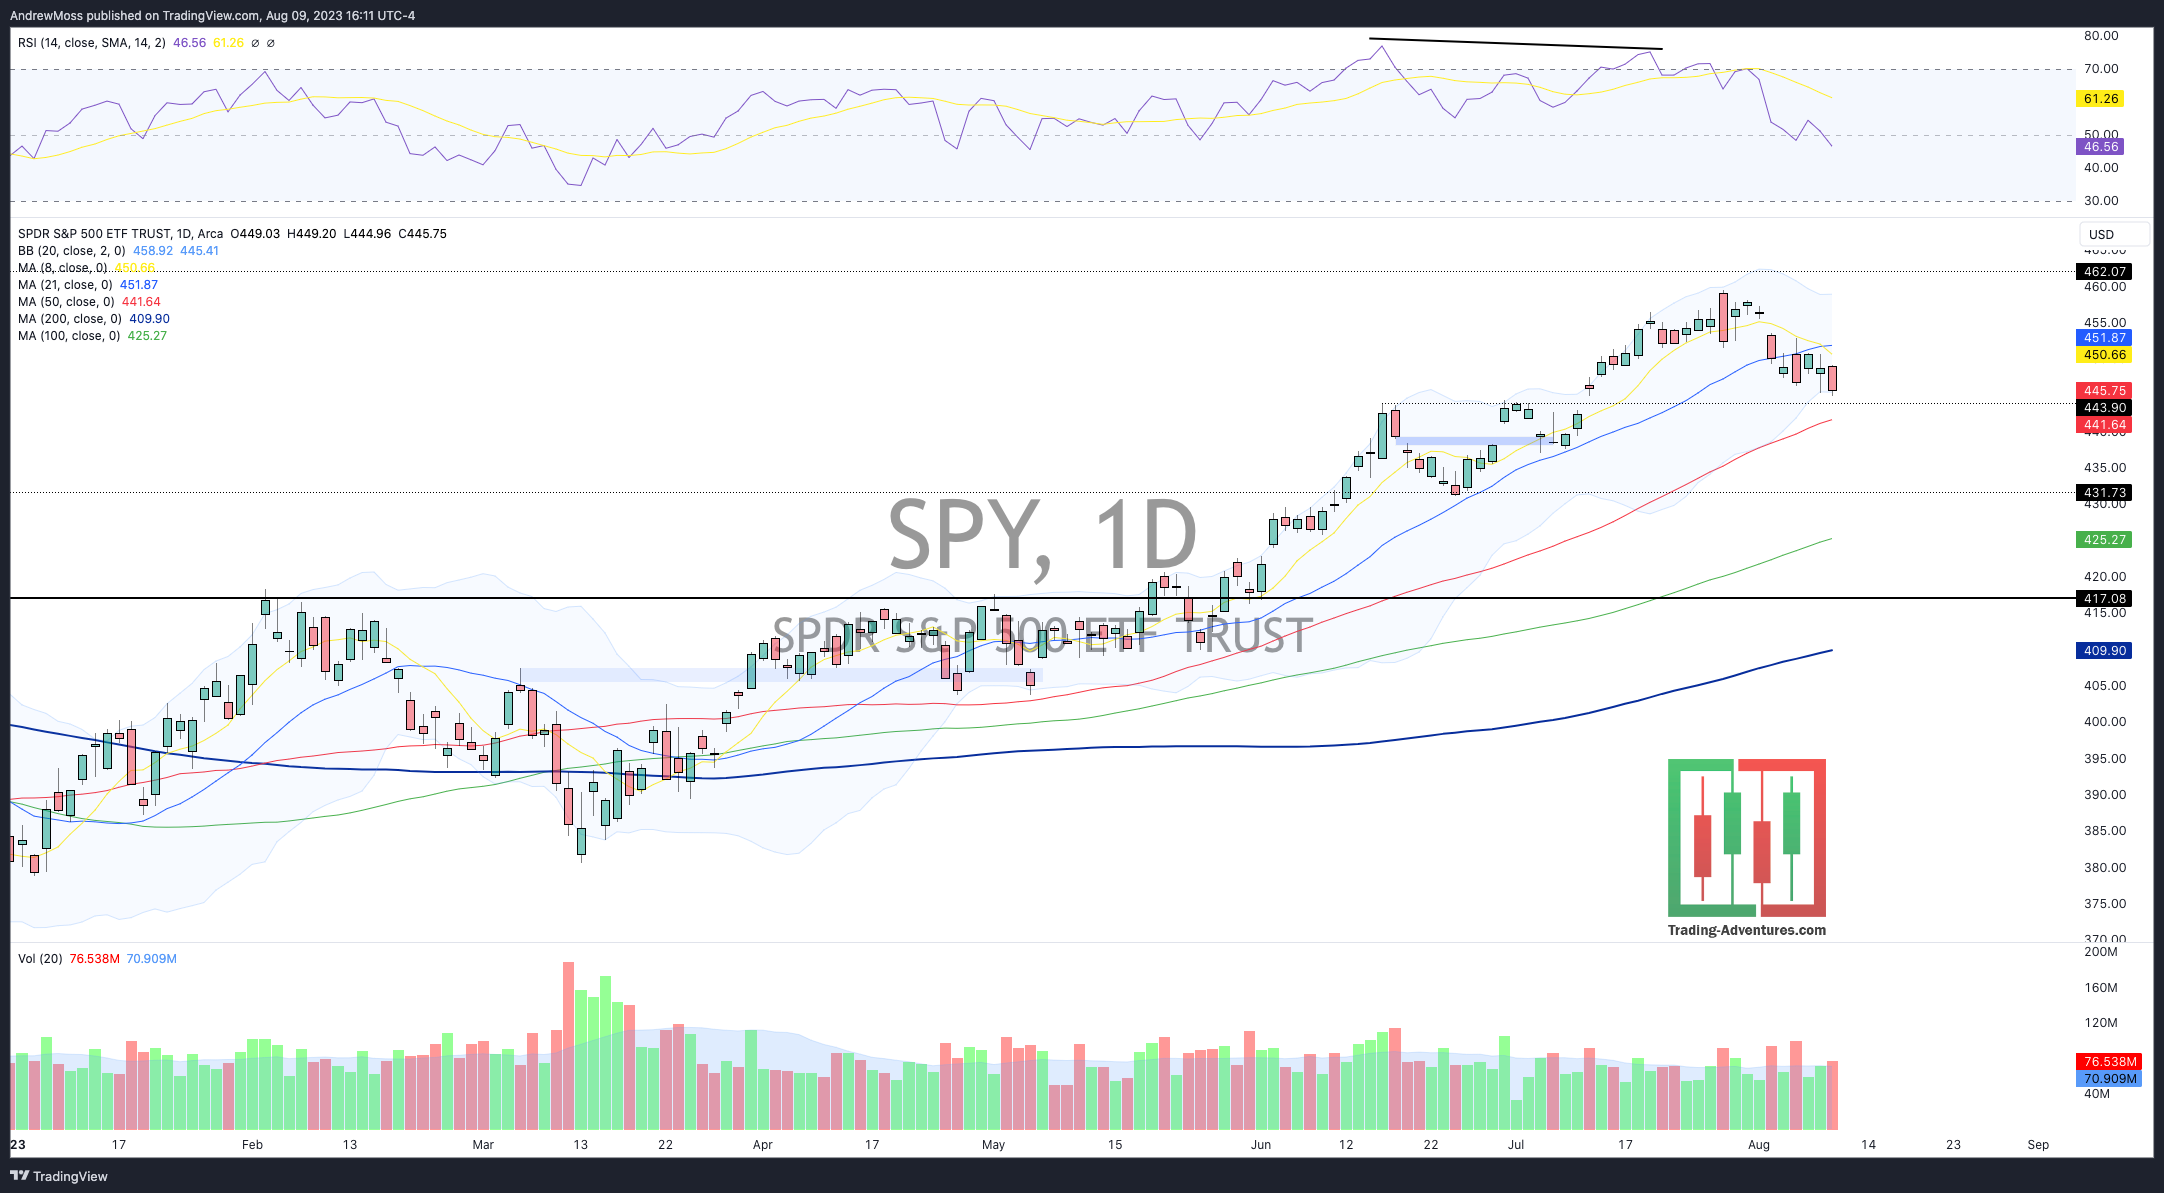
Maybe not. There’s no evidence yet to support the case that the bottom of this dip is in. For the last three days, SPY (NYSE:SPY) has rallied back up to the declining 5-day moving average and then gotten sold.
Any guesses about what happened today? Yep, #4.

Meanwhile, QQQ (NASDAQ:QQQ) is testing its 50-day MA after finding a recent high a little sooner and has come down a little further than SPY (down a bit more than -5% from the recent high to today’s low vs. SPY which is lower by -3%.)
If the 50-day can not provide support, the next major levels below are a pivot near $357, followed by the 100-day MA near $344.
Let’s go to the charts.
The Charts
SPY closed near the lows of the day and is approaching that retest of the breakout level, around $444. Below that is 50-day MA near $441.
QQQ closed below the 50-day MA. Now watch the potential support levels indicated previously.

IWM (NYSE:IWM) is testing the support/resistance zone (shaded area) and the VWAP anchored to the all-time high.

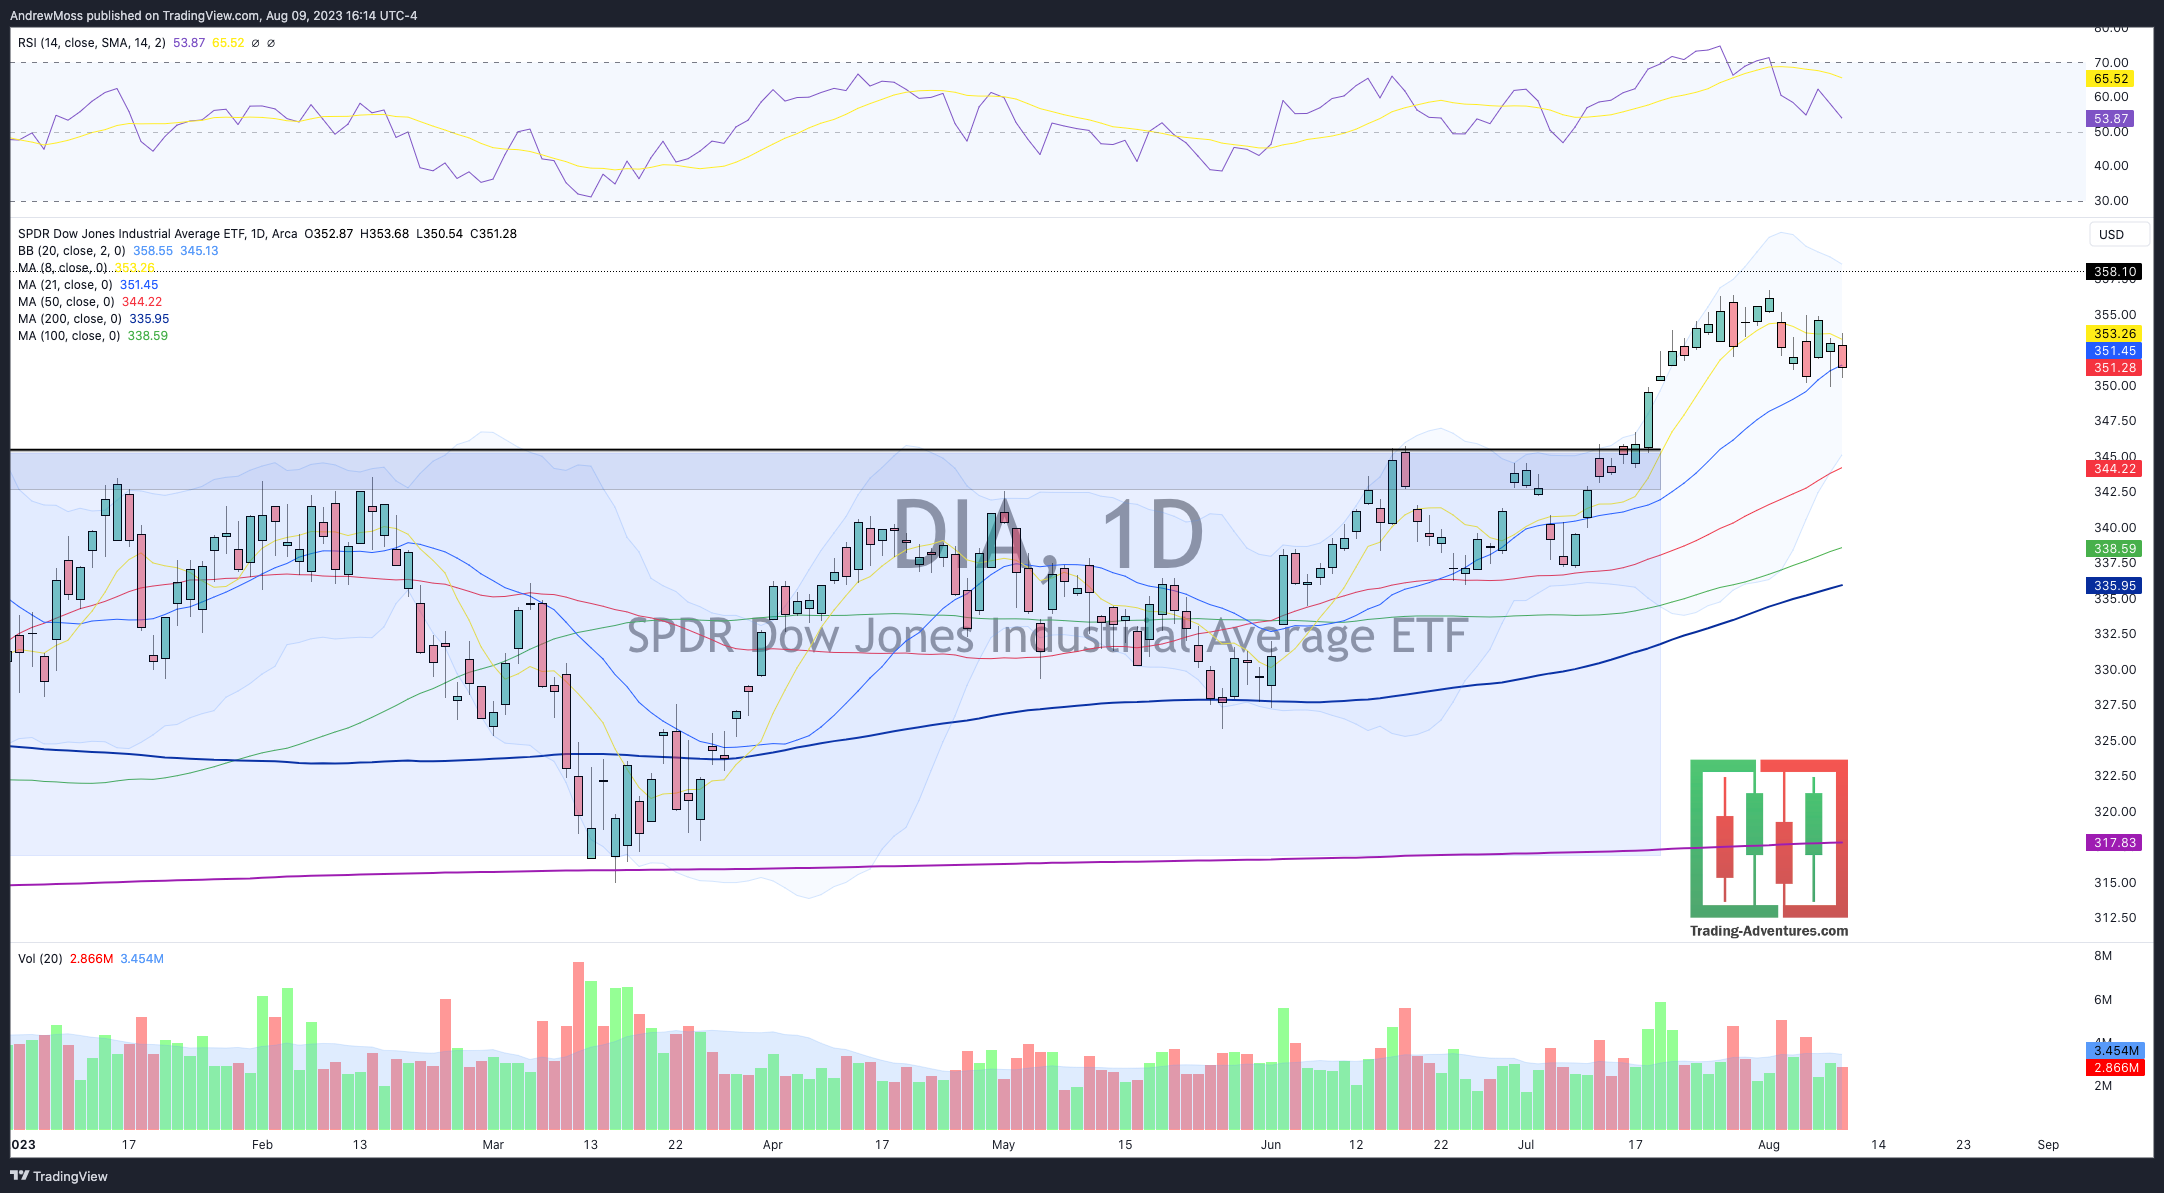
DIA (NYSE:DIA) has been a benefit of buying rotation to industrials lately, which has helped it stay above the 21-day MA until today. $344-$345 is the next area to watch below.
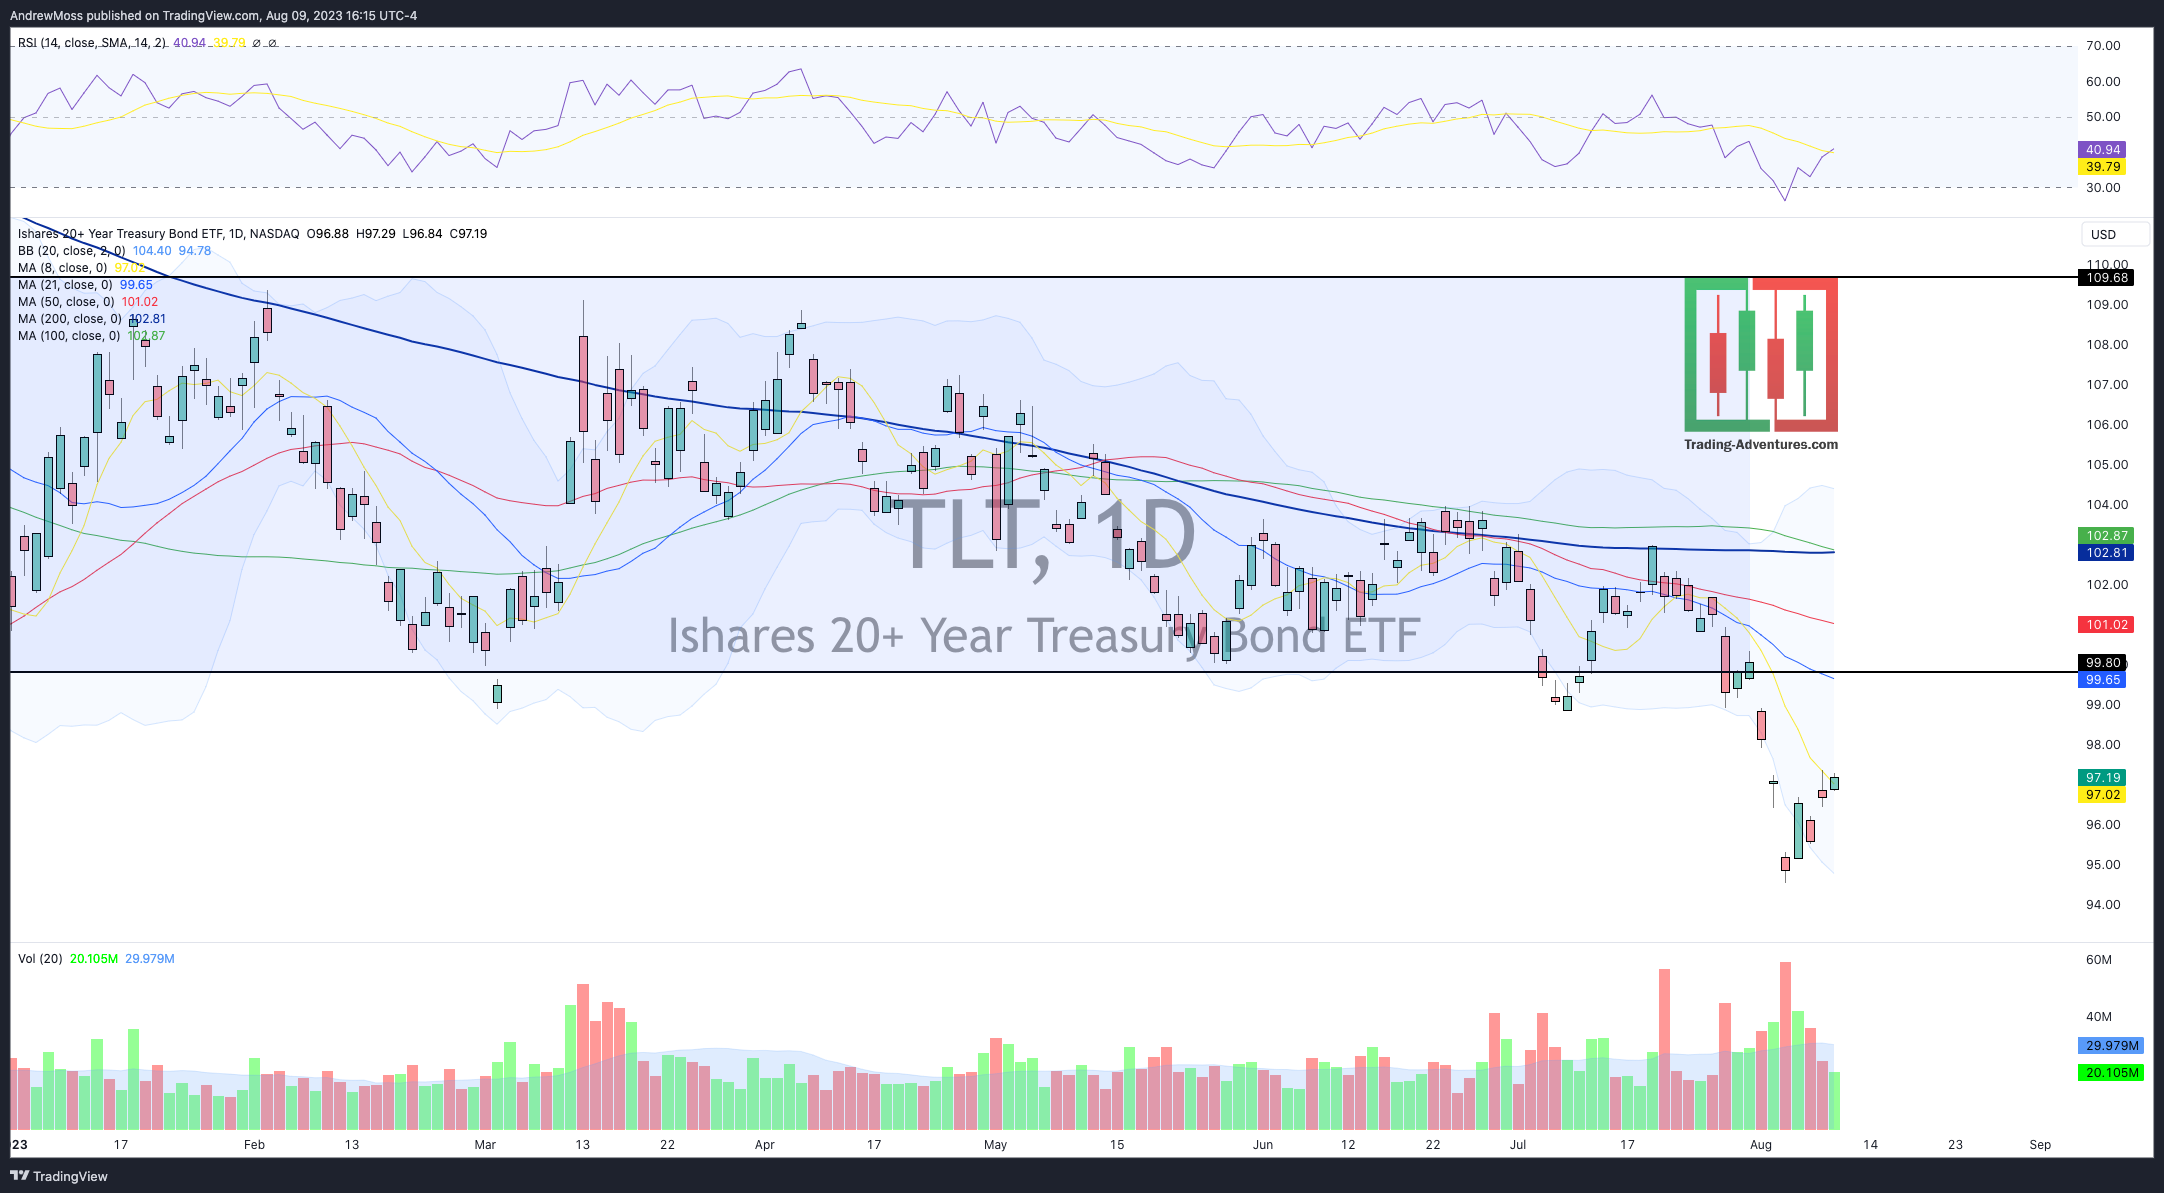
TLT (NASDAQ:TLT) Bonds and interest rate yields continue to be a market focus. This index has worked off the oversold condition by rallying up to the declining 8-day MA. Now we need to see if that was just temporary relief. Or can Treasury Bonds keep moving higher, pushing yields lower?
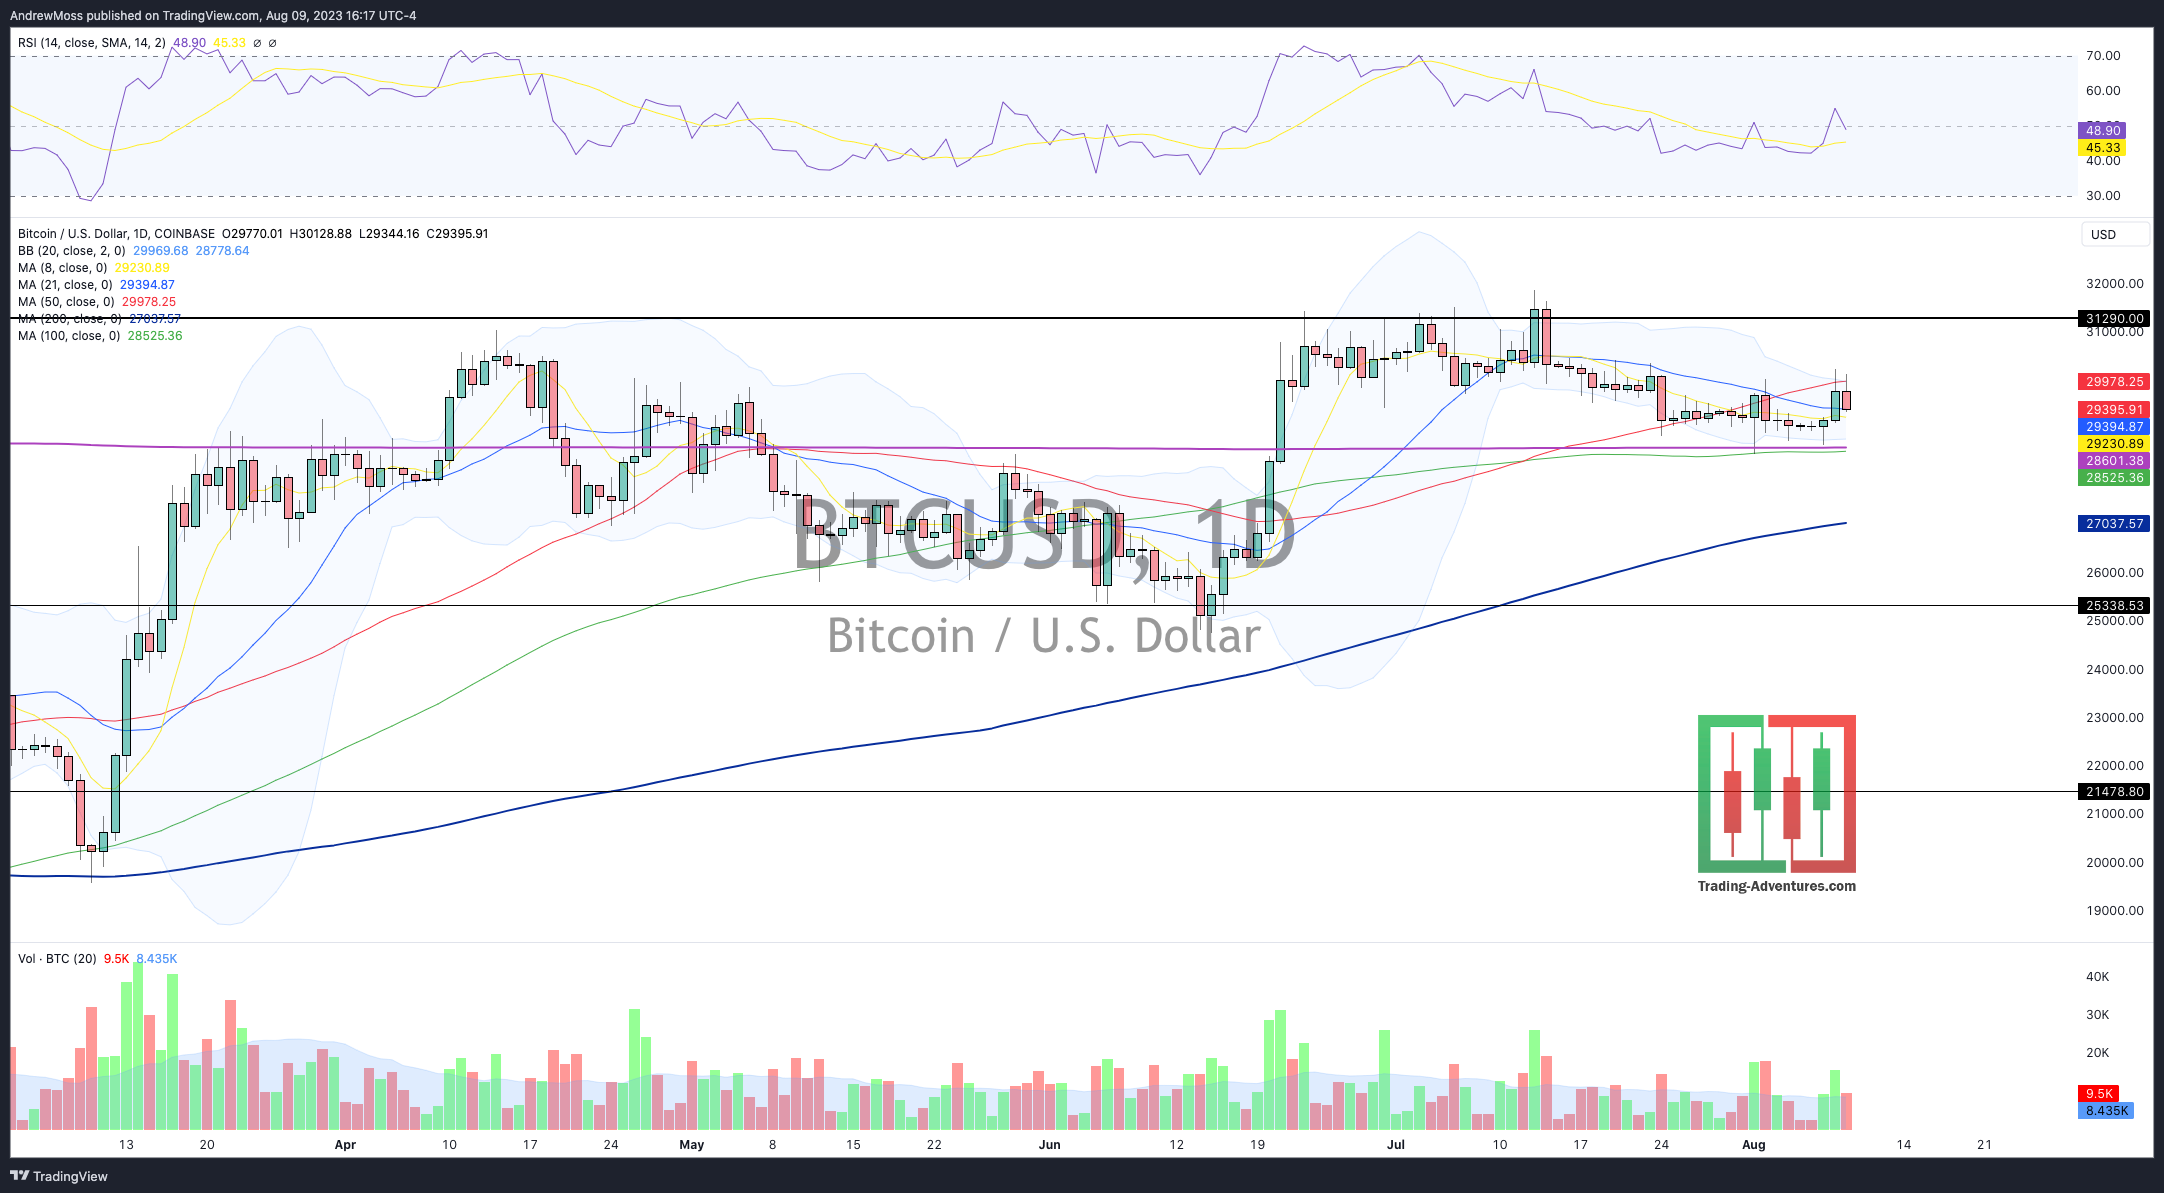
BTC (CRYPTO: BTC) has been relatively calm while stocks get slightly rattled. The move up yesterday quickly attracted sellers today. The action is insignificant so far though as it stays rangebound.
DXY The US Dollar continues to give the feeling that the path of least resistance is higher. The real test though, will be the downtrend line.

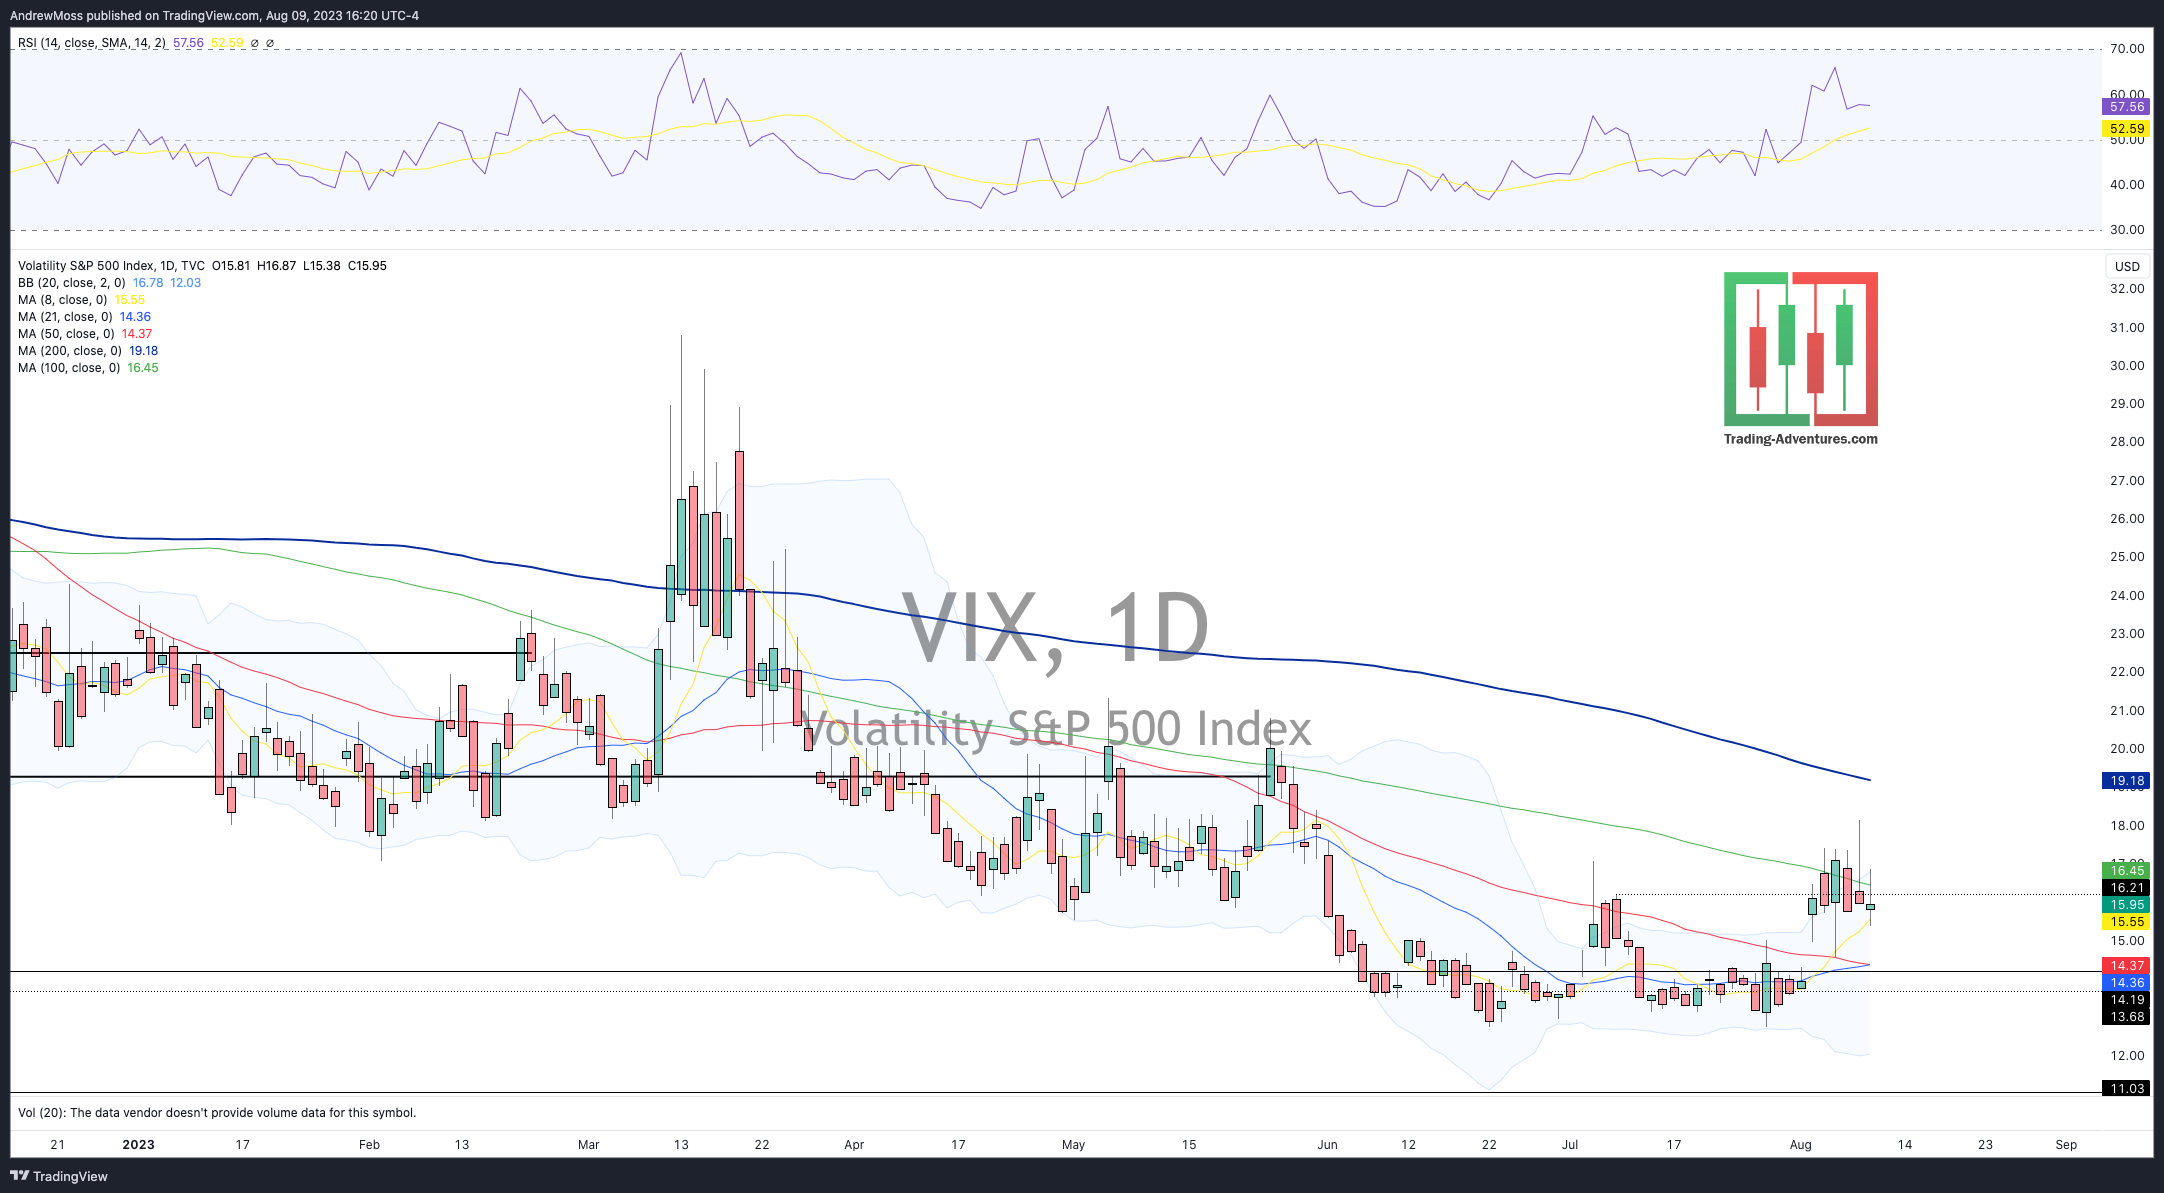
VIX Volatility remains slightly elevated as we head into the CPI inflation report tomorrow morning.
The Closing Bell
The latest CPI data will be announced tomorrow morning, here’s what to watch for.
Does higher-than-expected inflation data send the market lower? If so, watch the levels mentioned earlier.
Or can the market rally on good inflation data? If that happens, watch how the indexes and individual stocks on your watchlist handle the 5-day MA. Can they move above? And can the MA curl up and begin moving higher too?
If so, you will have the first piece of evidence suggesting the potential of a short-term bottom.
Subscribe to Trading Adventures and follow on Twitter/X for more charts and comments along the way.
The Disclosures
***This is NOT financial advice. NOT a recommendation to buy, sell, or trade any security. The content presented here is intended for educational purposes only.
Andrew Moss is an associated member of T3 Trading Group, LLC (“T3TG”) a SEC registered broker/dealer and member of FINRA/SIPC. All trades placed by Mr. Moss are done through T3TG.
Statements in this article represent the opinions of that person only and do not necessarily reflect the opinions of T3TG or any other person associated with T3TG.
It is possible that Mr. Moss may hold an investment position (or may be contemplating holding an investment position) that is inconsistent with the information provided or the opinion being expressed. This may reflect the financial or other circumstances of the individual or it may reflect some other consideration. Readers of this article should take this into account when evaluating the information provided or the opinions being expressed.
All investments are subject to the risk of loss, which you should consider in making any investment decisions. Readers of this article should consult with their financial advisors, attorneys, accountants, or other qualified investors prior to making any investment decision.
POSITION DISCLOSURE
August 9, 2023, 4:00 PM
Long:
Short:
Options symbols are denoted as follows:
Ticker, Date, Call/Put, Strike Price
Example: VXX1218C30 = VXX 12/18 Call with a $30 strike
© 2025 Benzinga.com. Benzinga does not provide investment advice. All rights reserved.