


- United Airlines' stock faces bearish trend, trading below key moving averages, with MACD indicating sell-off.
- Despite positive earnings, technical indicators like RSI and Bollinger Bands signal caution for United Airlines stock investors.
- See the 6X seasonal strategy set to target this fall’s biggest opportunities. Details here →
United Airlines Holdings Inc‘s UAL stock has taken flight after reporting impressive first quarter earnings, surpassing market expectations.
The stock was up about 12% as of 10:30 a.m. ET on Wednesday, fueled by investor optimism around its upbeat earnings report.
Q1 Earnings Triumph Fueling The Stock Higher
- United Airlines reported first-quarter revenue of $12.5 billion, exceeding the consensus estimate of $12.4 billion.
- The company reported an adjusted quarterly loss of 15 cents per share, outperforming analyst estimates for a loss of 57 cents per share.
- Despite headwinds, including a 9.1% increase in capacity, the company improved TRASM by 0.6% and reduced CASM by 0.6%.
Also Read: Why United Airlines Stock Is Rising Wednesday
United Airlines’ Strategic Moves
United Airlines reiterated its expectations for full-year 2024 adjusted earnings of $9 to $11 per share, demonstrating confidence in future performance.
The company also announced the conversion of a portion of Boeing Co BA Max 10 orders to Boeing Max 9 orders, along with agreements with lessors to lease 35 new Airbus A321neos.
Technical Indicators Raise Red Flags

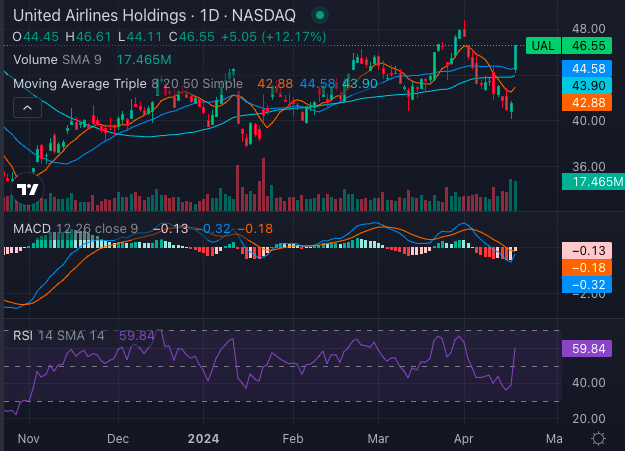
United Airlines’ stock is currently facing a bearish trend, with its price positioned below its 5-, 20-, and 50-day exponential moving averages (EMAs). Specifically, the 8-day simple moving average (SMA) is below the current share price, indicating a sell-off. Additionally, both the 20-day and 50-day SMAs are situated below the stock’s current price, further reinforcing the bearish sentiment.
The Moving Average Convergence Divergence (MACD) indicator stands at -0.32, suggesting a sell-off for the stock and implying a negative trend in momentum.
Moreover, the Relative Strength Index (RSI) of 59.84 points to oversold conditions, indicating the potential for a reversal, albeit amidst prevailing downward pressure.
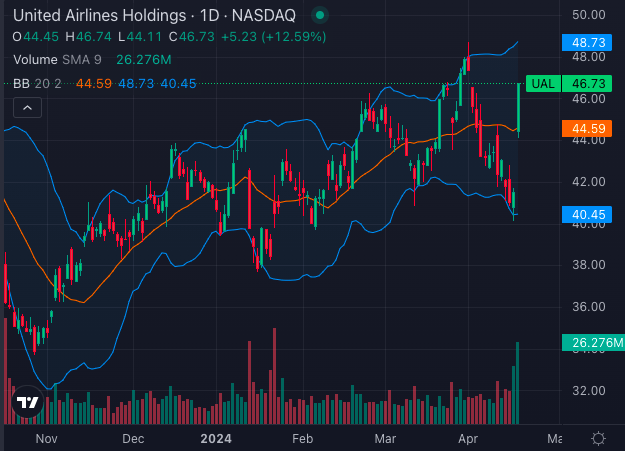
The Bollinger Bands also reflect a bearish outlook, with the price trading in the lower band, indicating sell-off conditions.
Despite the positive earnings report, these technical indicators collectively highlight the cautious stance investors should adopt, emphasizing the importance of closely monitoring the stock’s price movements for potential opportunities in line with prevailing market dynamics.
United Airlines’ stellar first-quarter performance reflects resilience amidst industry challenges. While technical indicators paint a cautious picture, investor optimism and strategic initiatives hint at a promising future for the stock.
As market dynamics evolve, investors should closely monitor United Airlines’ trajectory for potential opportunities.
Photo: Courtesy United Airlines
Edge Rankings
Price Trend
© 2025 Benzinga.com. Benzinga does not provide investment advice. All rights reserved.