

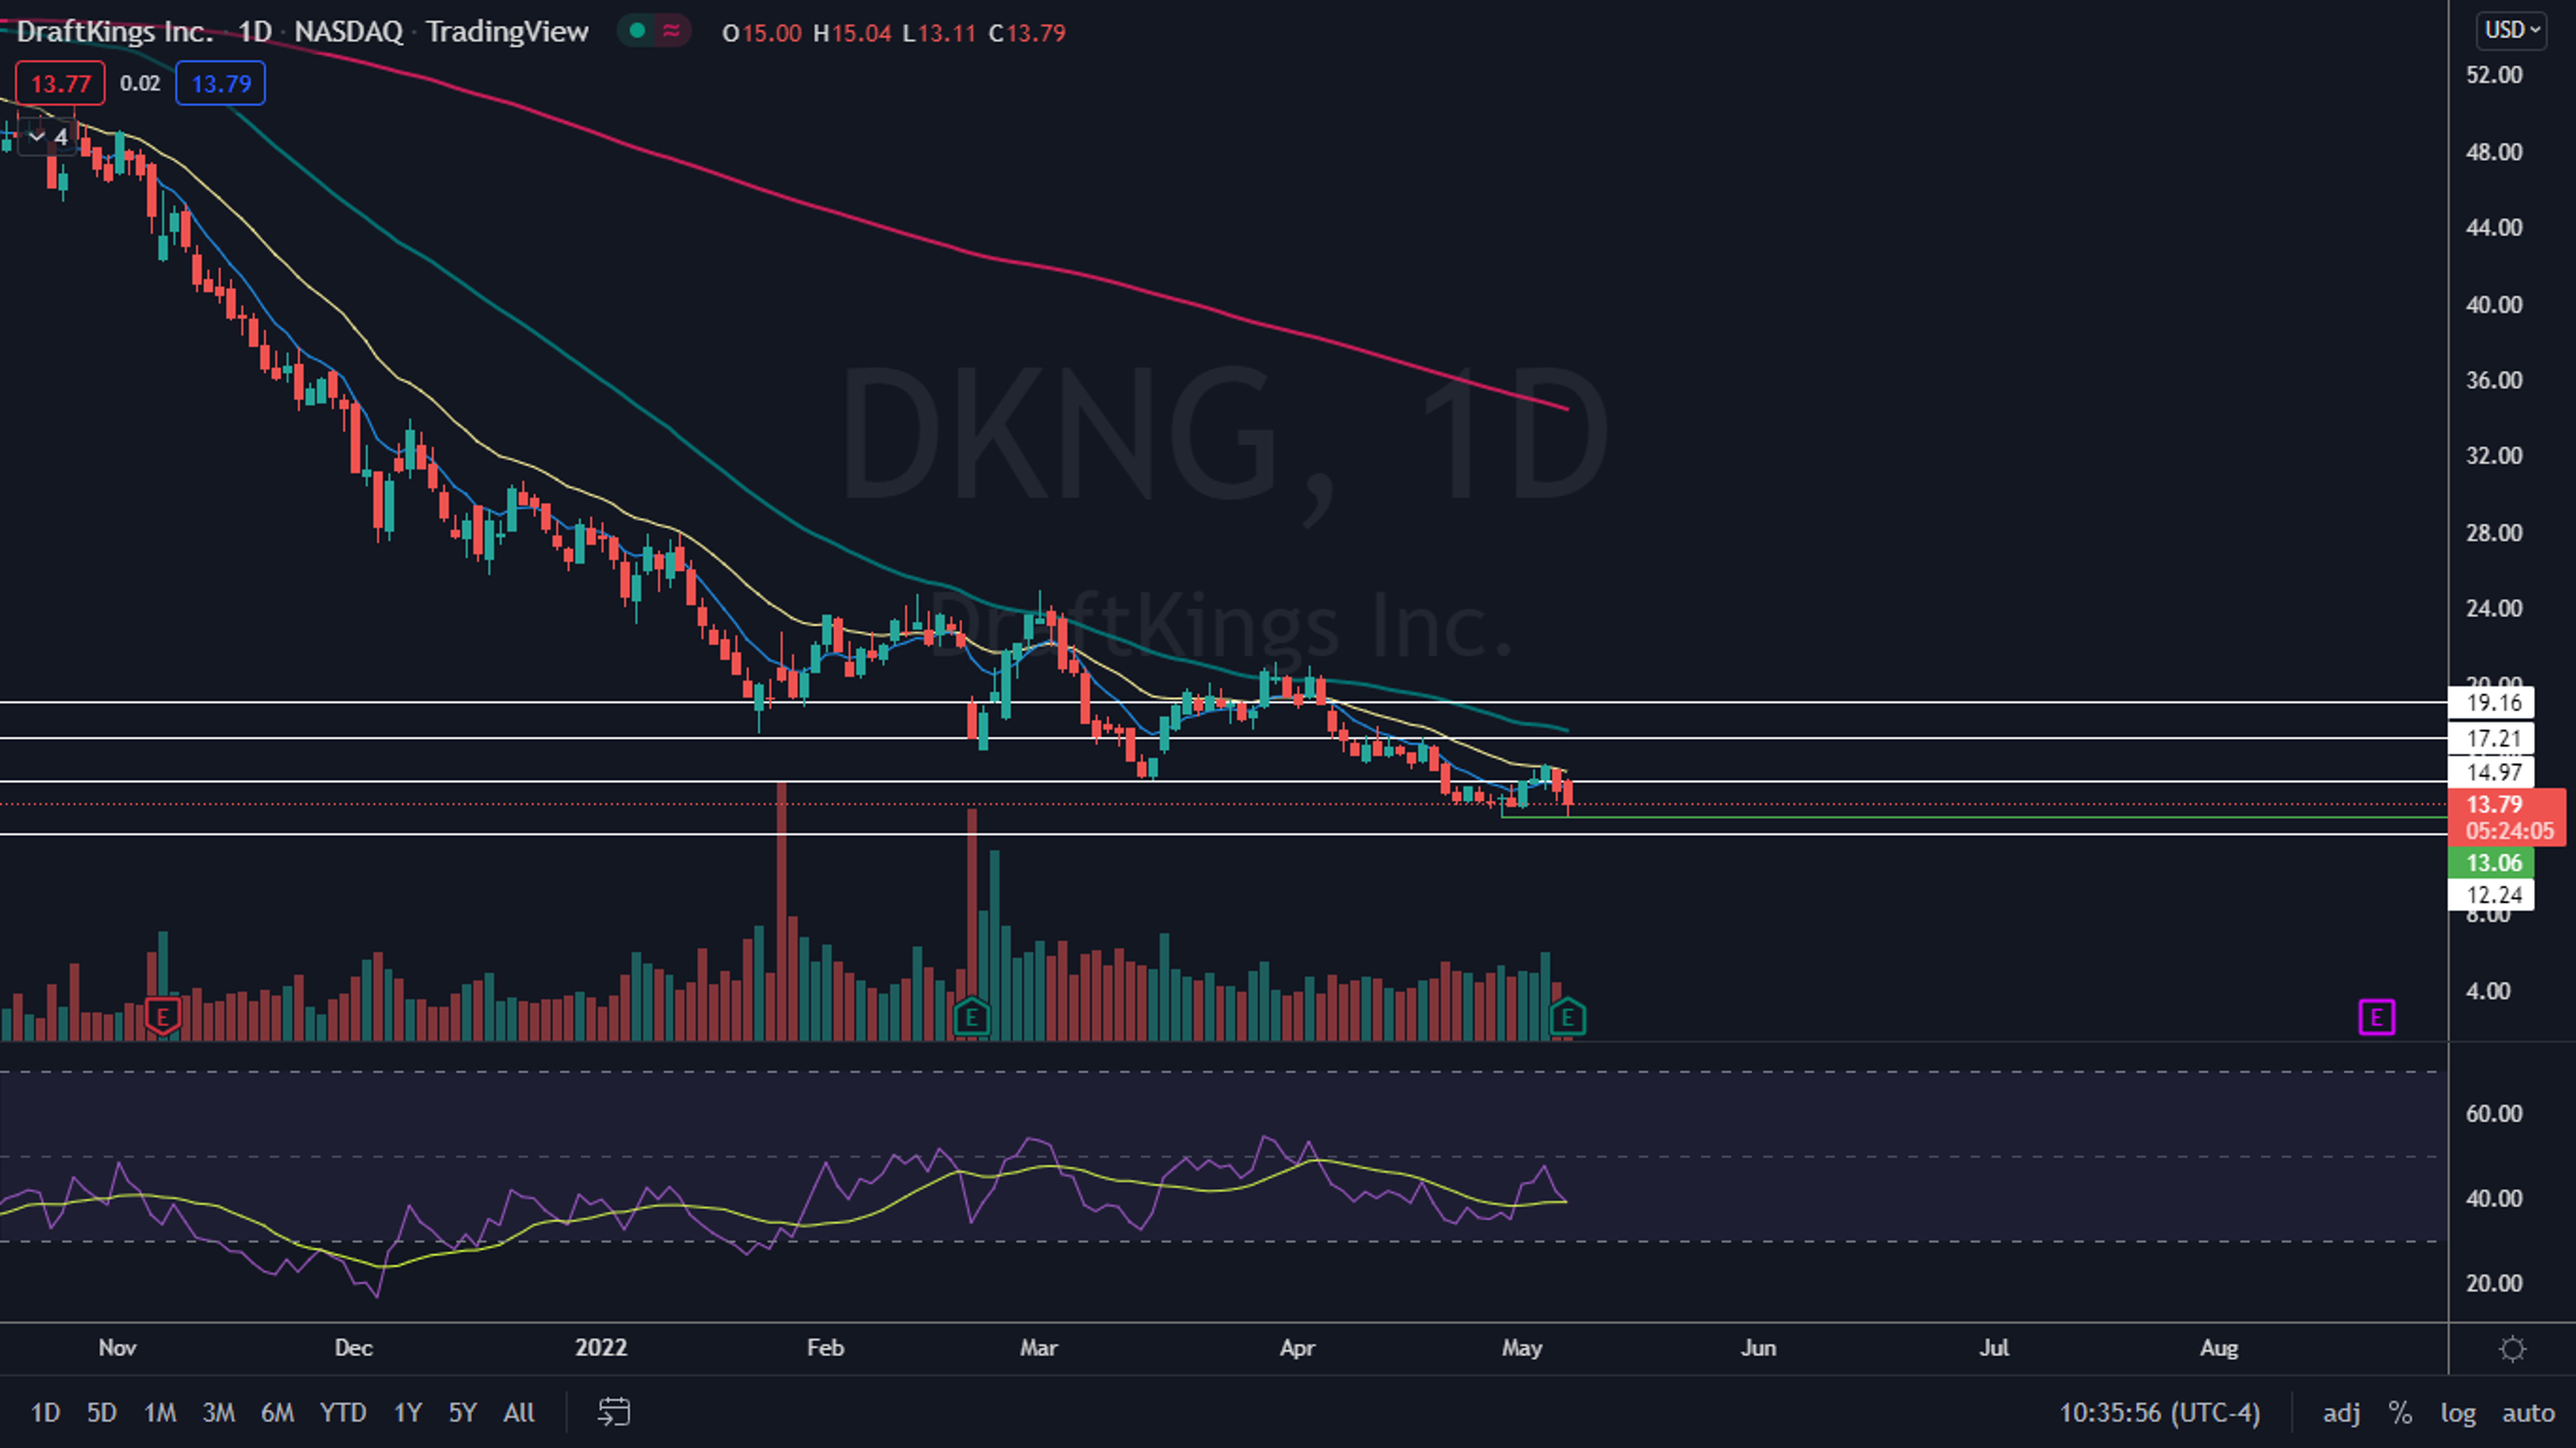
Draftkings, Inc DKNG hit near to the 52-week low of $13.06 again on Friday but began to bounce up from the level at 10 a.m. when the S&P 500 began to make a reversal from its low-of-day price.
DraftKings’ reaction to the level, when paired with similar price action on April 28, has set the stock into a possible bullish double bottom pattern on the daily chart, which indicates a reversal could be in the cards.
DraftKings reported better than expected first-quarter earnings, with revenues of $417 million, which beat the consensus estimate of $414.4 million. The online-gaming and sports-betting company also raised its guidance and expects full-year revenue to reach between $1.925 billion to $2.025 billion, versus the previous $1.85 billion to $2 billion range.
The Pattern: A double bottom pattern is a reversal indicator that shows a stock has dropped to a key support level, rebounded, back tested the level as support and is likely to rebound again. It is possible the stock may retest the level as support again creating a triple bottom or even quadruple bottom pattern.
The formation is always identified after a security has dropped in price and is at the bottom of a downtrend whereas a bearish double top pattern is always found in an uptrend. A spike in volume confirms the double bottom pattern was recognized and subsequent increasing volume may indicate the stock will reverse into an uptrend.
- Aggressive bullish traders may choose to take a position when the stock’s volume spikes after the second retest of the support level. Conservative bullish traders may wait to take a position when the stock’s share price has surpassed the level of the initial rebound (the high before the second bounce from the support level).
- Bearish traders may choose to open a short position if the stock rejects at the level of the first rebound or if the stock falls beneath the key support level it created the double bottom pattern.
Want direct analysis? Find me in the BZ Pro lounge! Click here for a free trial.
The DraftKings Chart: DraftKings has plunged more than 80% since reaching an all-time high of $74.38 on March 22, 2021. The stock has been trading in a heavy and consistent downtrend on the weekly chart since Sept. 7, 2021, when DraftKings topped out at the $64.58 mark.
- If DraftKings is able to bounce up over the $15.88 level over the coming days, it may indicate an uptrend is about to begin, although the stock will eventually need to retrace downwards to print a lower high to confirm the trend.
- DraftKings has developed bullish divergence on its chart, which suggests a bounce up to form a higher high is likely. Bullish divergence occurs when a stock’s relative strength index forms a series of higher lows while the stock’s price forms lower lows.
- DraftKings has resistance above at $14.97 and $17.21 and support below at $13.06 and $12.24.

Edge Rankings
Price Trend
© 2025 Benzinga.com. Benzinga does not provide investment advice. All rights reserved.
Trade confidently with insights and alerts from analyst ratings, free reports and breaking news that affects the stocks you care about.

