
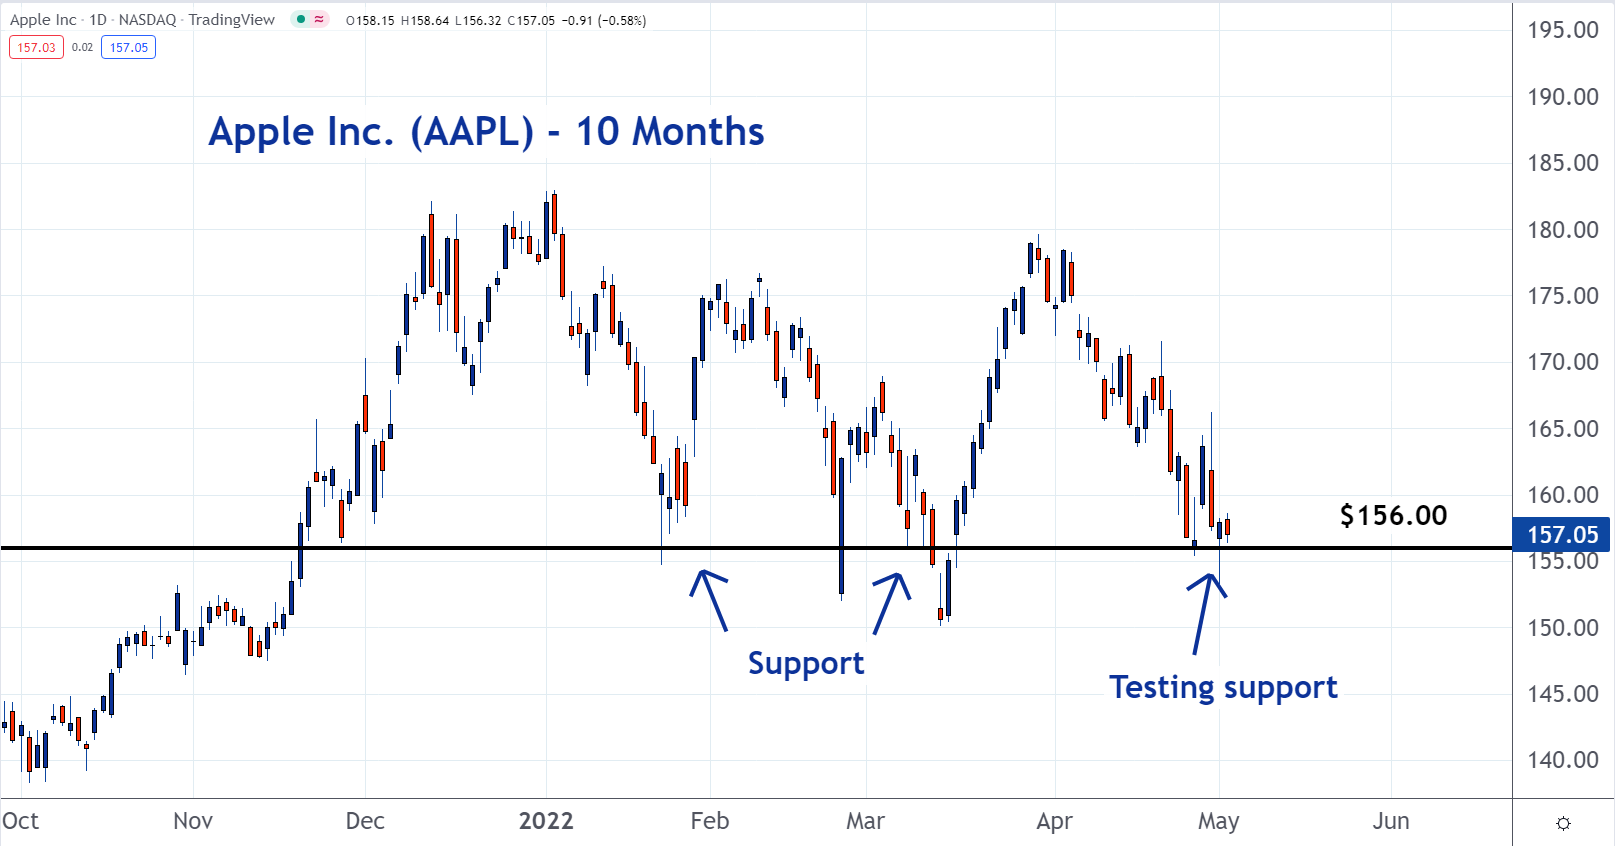
Shares of Apple Inc. AAPL are holding above critical support, but if this support breaks, the stock could form a new downtrend.
Support is a large group of buyers looking to buy shares at, or close to, the same price. As you can see on the following chart, in this case, it's $156.
If the price of a stock falls below the support level, traders say the support has been "broken." This is typically a bearish dynamic. It shows that the investors who created the support are gone; They've finished or canceled their orders.
With this demand for the stock taken out of the market, sellers will be forced to accept lower prices. This could push Apple's stock into a new downtrend.
To learn more about trading, check out the new Benzinga Trading School.
© 2024 Benzinga.com. Benzinga does not provide investment advice. All rights reserved.
Comments
Trade confidently with insights and alerts from analyst ratings, free reports and breaking news that affects the stocks you care about.

