


Zinger Key Points
- Snap has a 52-week high of $83.34 and a 52-week low of $24.32.
- Learn the top momentum trading strategies for today’s whipsaw market, live with Chris Capre on Sunday, May 4 at 1 PM ET. Reserve your free spot now.
Snap, Inc SNAP opened slightly higher on Thursday but continued in its descent, falling back toward Wednesday’s closing price by late afternoon.
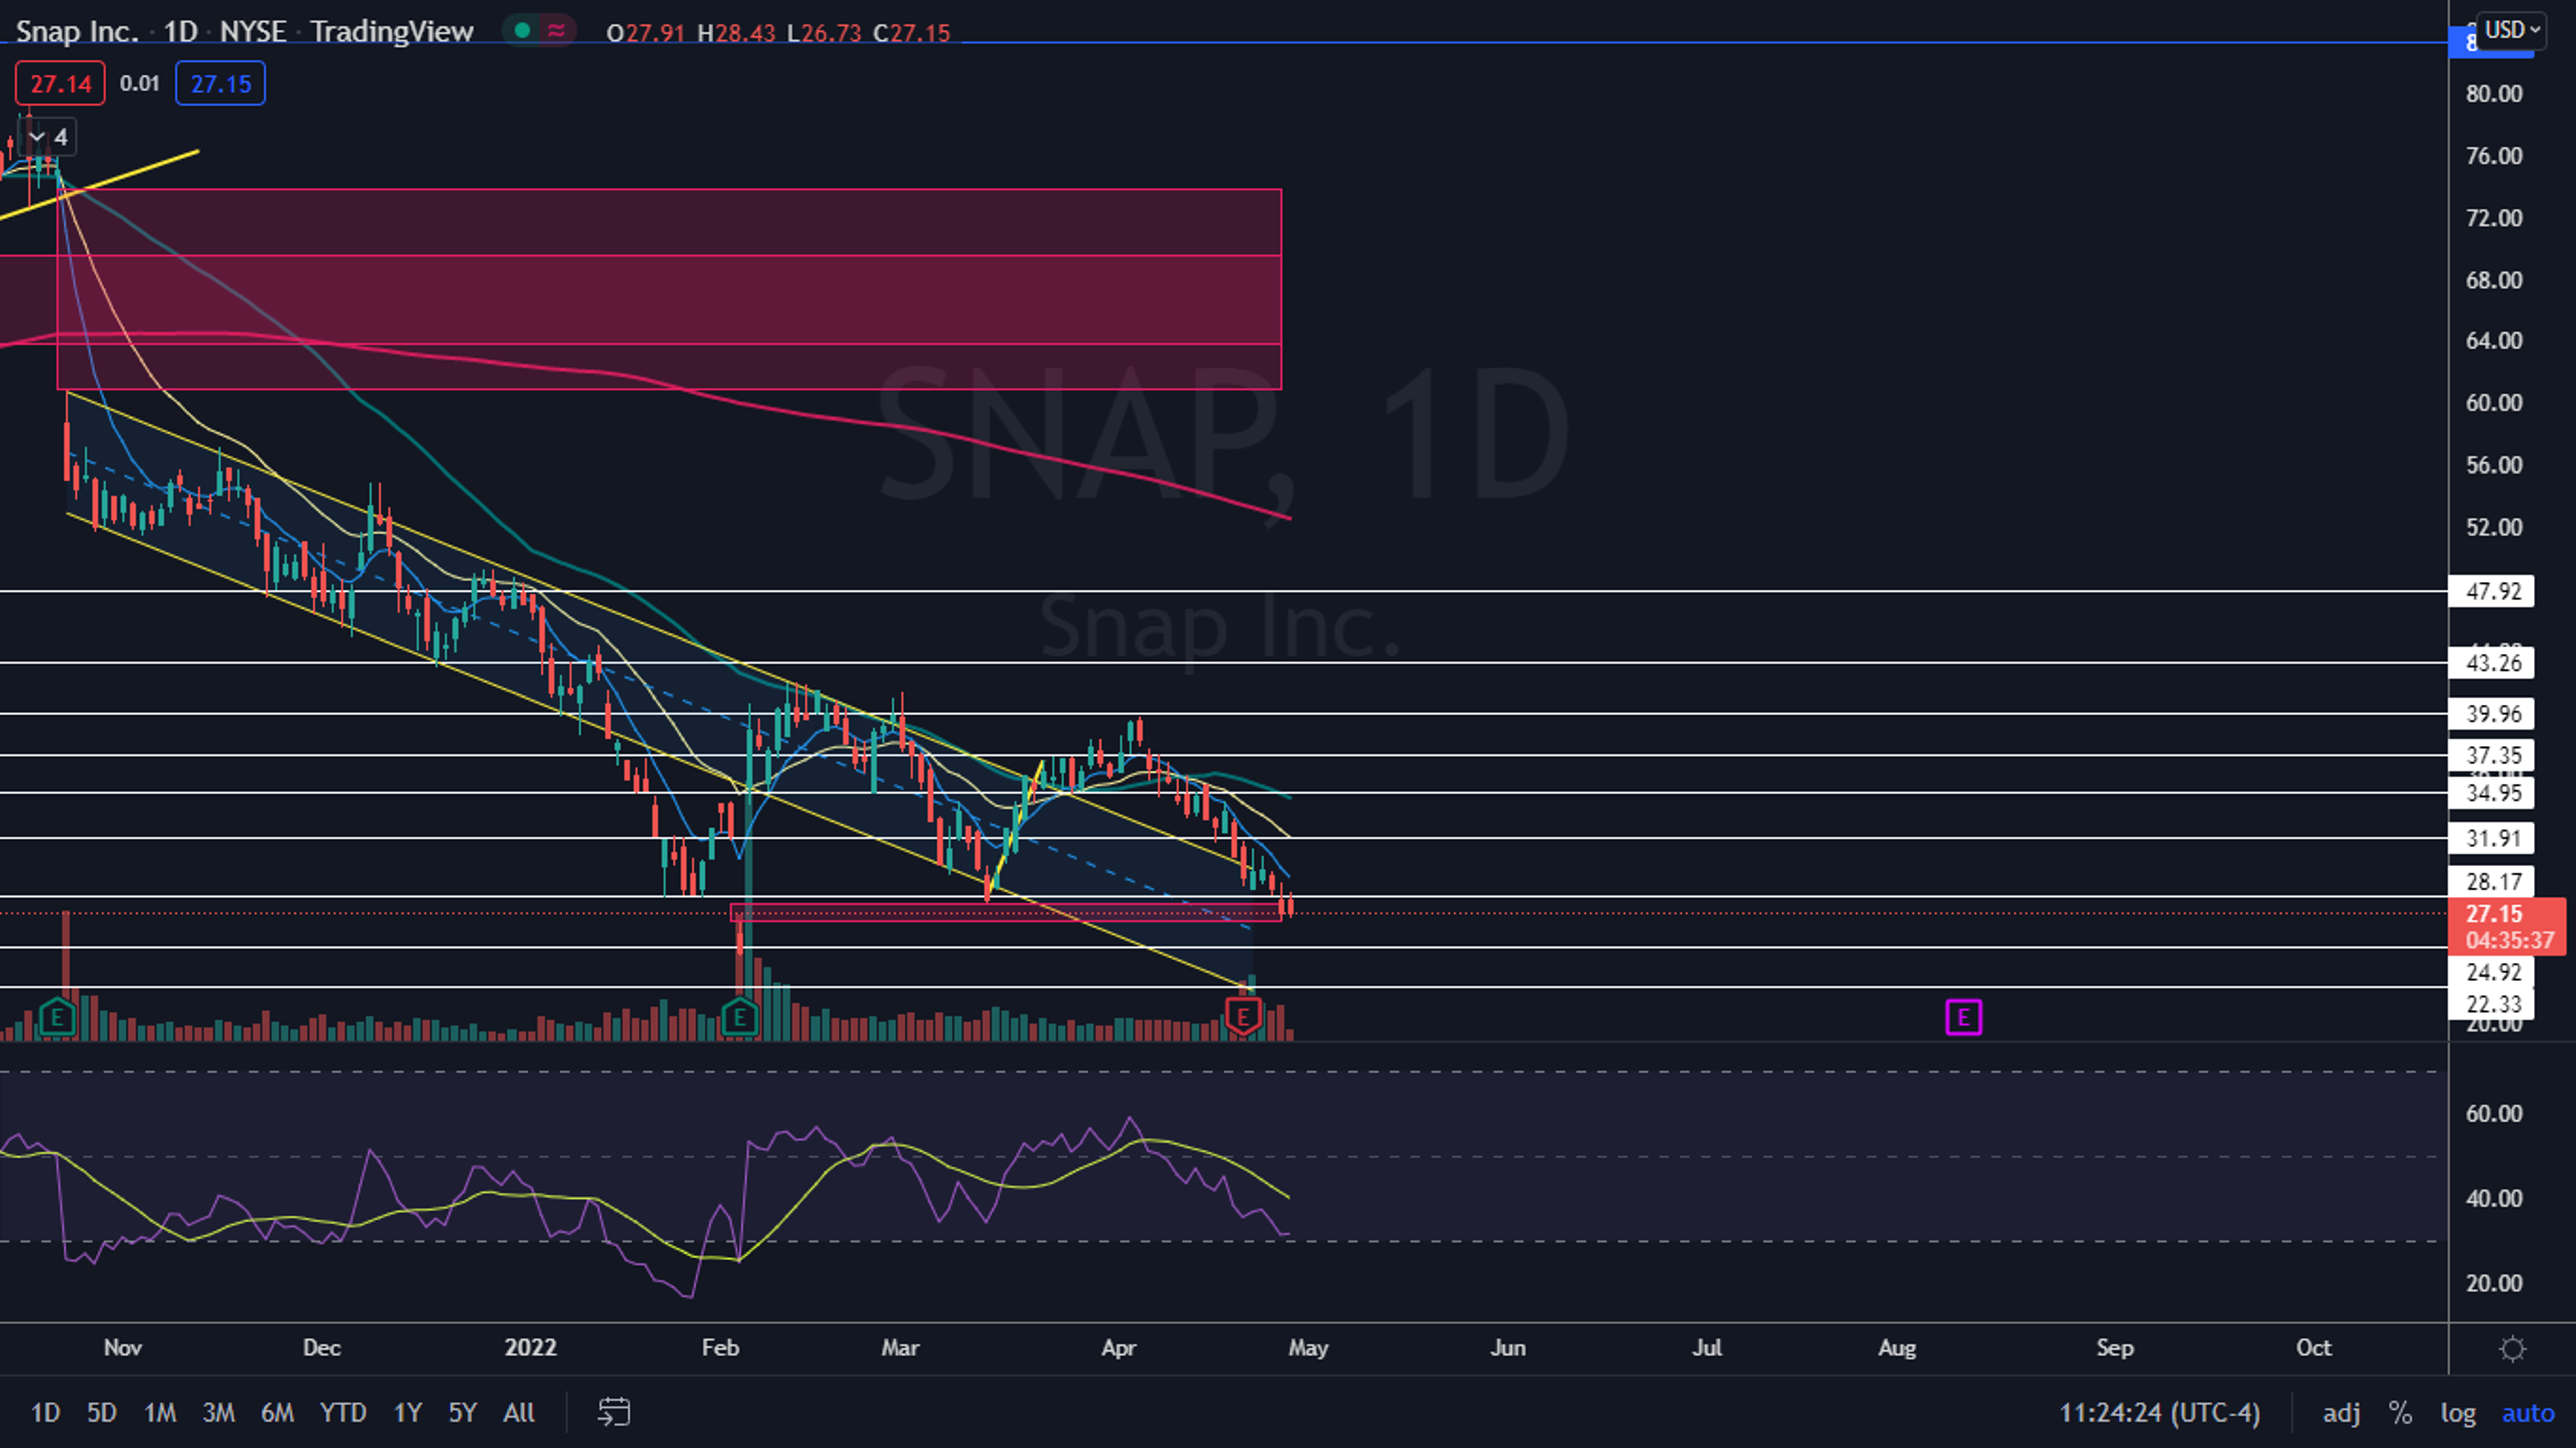
The parent company of Snapchat has been trading in a heavy downtrend since April 5, plunging over 32% from the high of $39.80 printed on that day to $26.56 on Wednesday, which is less than $2 above the Feb. 3 52-week low of $24.32.
A downtrend occurs when a stock consistently makes a series of lower lows and lower highs on the chart.
The lower lows indicate the bears are in control while the intermittent lower highs indicate consolidation periods.
Traders can use moving averages to help identify an uptrend with descending lower timeframe moving averages (such as the eight-day or 21-day exponential moving averages) indicating the stock is in a steep shorter-term downtrend and descending longer-term moving averages (such as the 200-day simple moving average) indicating a long-term downtrend.
A stock often signals when the lower low is in by printing a reversal candlestick such as a doji, bullish engulfing or hammer candlestick. Likewise, the lower high could be signaled when a doji, gravestone or dragonfly candlestick is printed. Moreover, the lower lows and lower highs often take place at resistance and support levels.
In a downtrend the "trend is your friend" until it’s not and in a downtrend, there are ways for both bullish and bearish traders to participate in the stock:
- Bearish traders who are already holding a position in a stock can feel confident the downtrend will continue unless the stock makes a higher high. Traders looking to take a position in a stock trading in a downtrend can usually find the safest entry on the lower high.
- Bullish traders can enter the trade on the lower low and exit on the lower high. These traders can also enter when the downtrend breaks and the stock makes a higher high indicating a reversal into an uptrend may be in the cards.
Want direct analysis? Find me in the BZ Pro lounge! Click here for a free trial.
The Snap Chart: Snap’s most recent lower high in its downtrend was printed on April 25 at $30.79 and the most recent confirmed lower low was formed at the $28.56 level the day prior. On Wednesday, Snap dipped to fill a lower gap between the $26.49 and $27.67 levels, which may have marked the next lower low.
- The next low may not be in, however, because on Thursday Snap was printing an inside bar on the daily chart, with all of the price action within Wednesday’s trading range. The pattern leans bearish in this case because Snap is in a downtrend. Traders and investors can watch for a break up or down from the pattern later on Thursday or on Friday to gauge future price direction.
- A bounce up to at least print another lower high is likely to take place over the coming days because Snap’s relative strength index (RSI) is measuring in at about 32%. When a stock’s RSI reaches or falls below the 30% level it becomes oversold, which can be a buy signal for technical traders.
- Snap has resistance above at $28.17 and $31.91 and support below at $24.92 and $22.33.

See Also: Snap And 2 Other Stocks Insiders Are Selling
Edge Rankings
Price Trend
© 2025 Benzinga.com. Benzinga does not provide investment advice. All rights reserved.
Trade confidently with insights and alerts from analyst ratings, free reports and breaking news that affects the stocks you care about.

