

Zinger Key Points
- On Monday, Nio printed a hammer candlestick on the daily chart, which indicates higher prices should come on Tuesday.
- If higher prices do come, it may give Nio enough power to break up from the falling channel.
- See how Matt Maley is positioning for post-Fed volatility and momentum—live this Sunday, June 22 at 1 PM ET.
Nio, Inc NIO hit a production milestone on Tuesday, successfully rolling its 200,000th electric vehicle off production lines at its Hefei plant in China.
The EV manufacturer, which currently supplies the Chinese and Norwegian markets, plans to expand its offerings in Germany, the Netherlands, Sweden and Denmark as it continues to ramp up production.
Despite its achievements, the beaten down stock has failed to make any major reversal to the upside, currently trading down about 74% from the Jan. 11, 2021 all-time high of $66.99. Nio has been affected by both the turbulence in the U.S. markets and regulatory concerns sparked by a standoff between the Chinese government and the U.S. Security and Exchange Commission, which the two bodies are working to resolve.
Most recently, Nio has been trading in a downtrend between two parallel lines, which has set the stock into a falling channel pattern on the daily chart. The pattern is considered to be bearish until the stock breaks up bullishly from the upper descending trendline of the channel on higher-than-average volume.
Want direct analysis? Find me in the BZ Pro lounge! Click here for a free trial.


The Nio Chart: Nio’s most recent lower high was printed April 13 at $20.56 and the most recent confirmed lower low was printed at the $17.77 level on April 11. On Monday, Nio may have formed its next consecutive lower low, but Tuesday’s candle will need to print for confirmation.
On Monday, Nio printed a hammer candlestick on the daily chart, which indicates higher prices should come on Tuesday. If higher prices do come, it may give Nio enough power to break up from the falling channel. If the stock unable to do so, bearish traders may find a solid entry if Nio prints a reversal candlestick, such as a doji or shooting star candlestick, below the upper trendline of the formation.
Nio has a gap above on its chart between $26.41 and $27.22. Gaps on charts fill about 90% of the time, which makes it likely the stock will trade up to fill the empty range in the future, Of course, it could be some time until that occurs because it would require a major trend change to the upside.
Nio has resistance above at $20.25 and $21.77 and support below at $16.75 and $14.31.

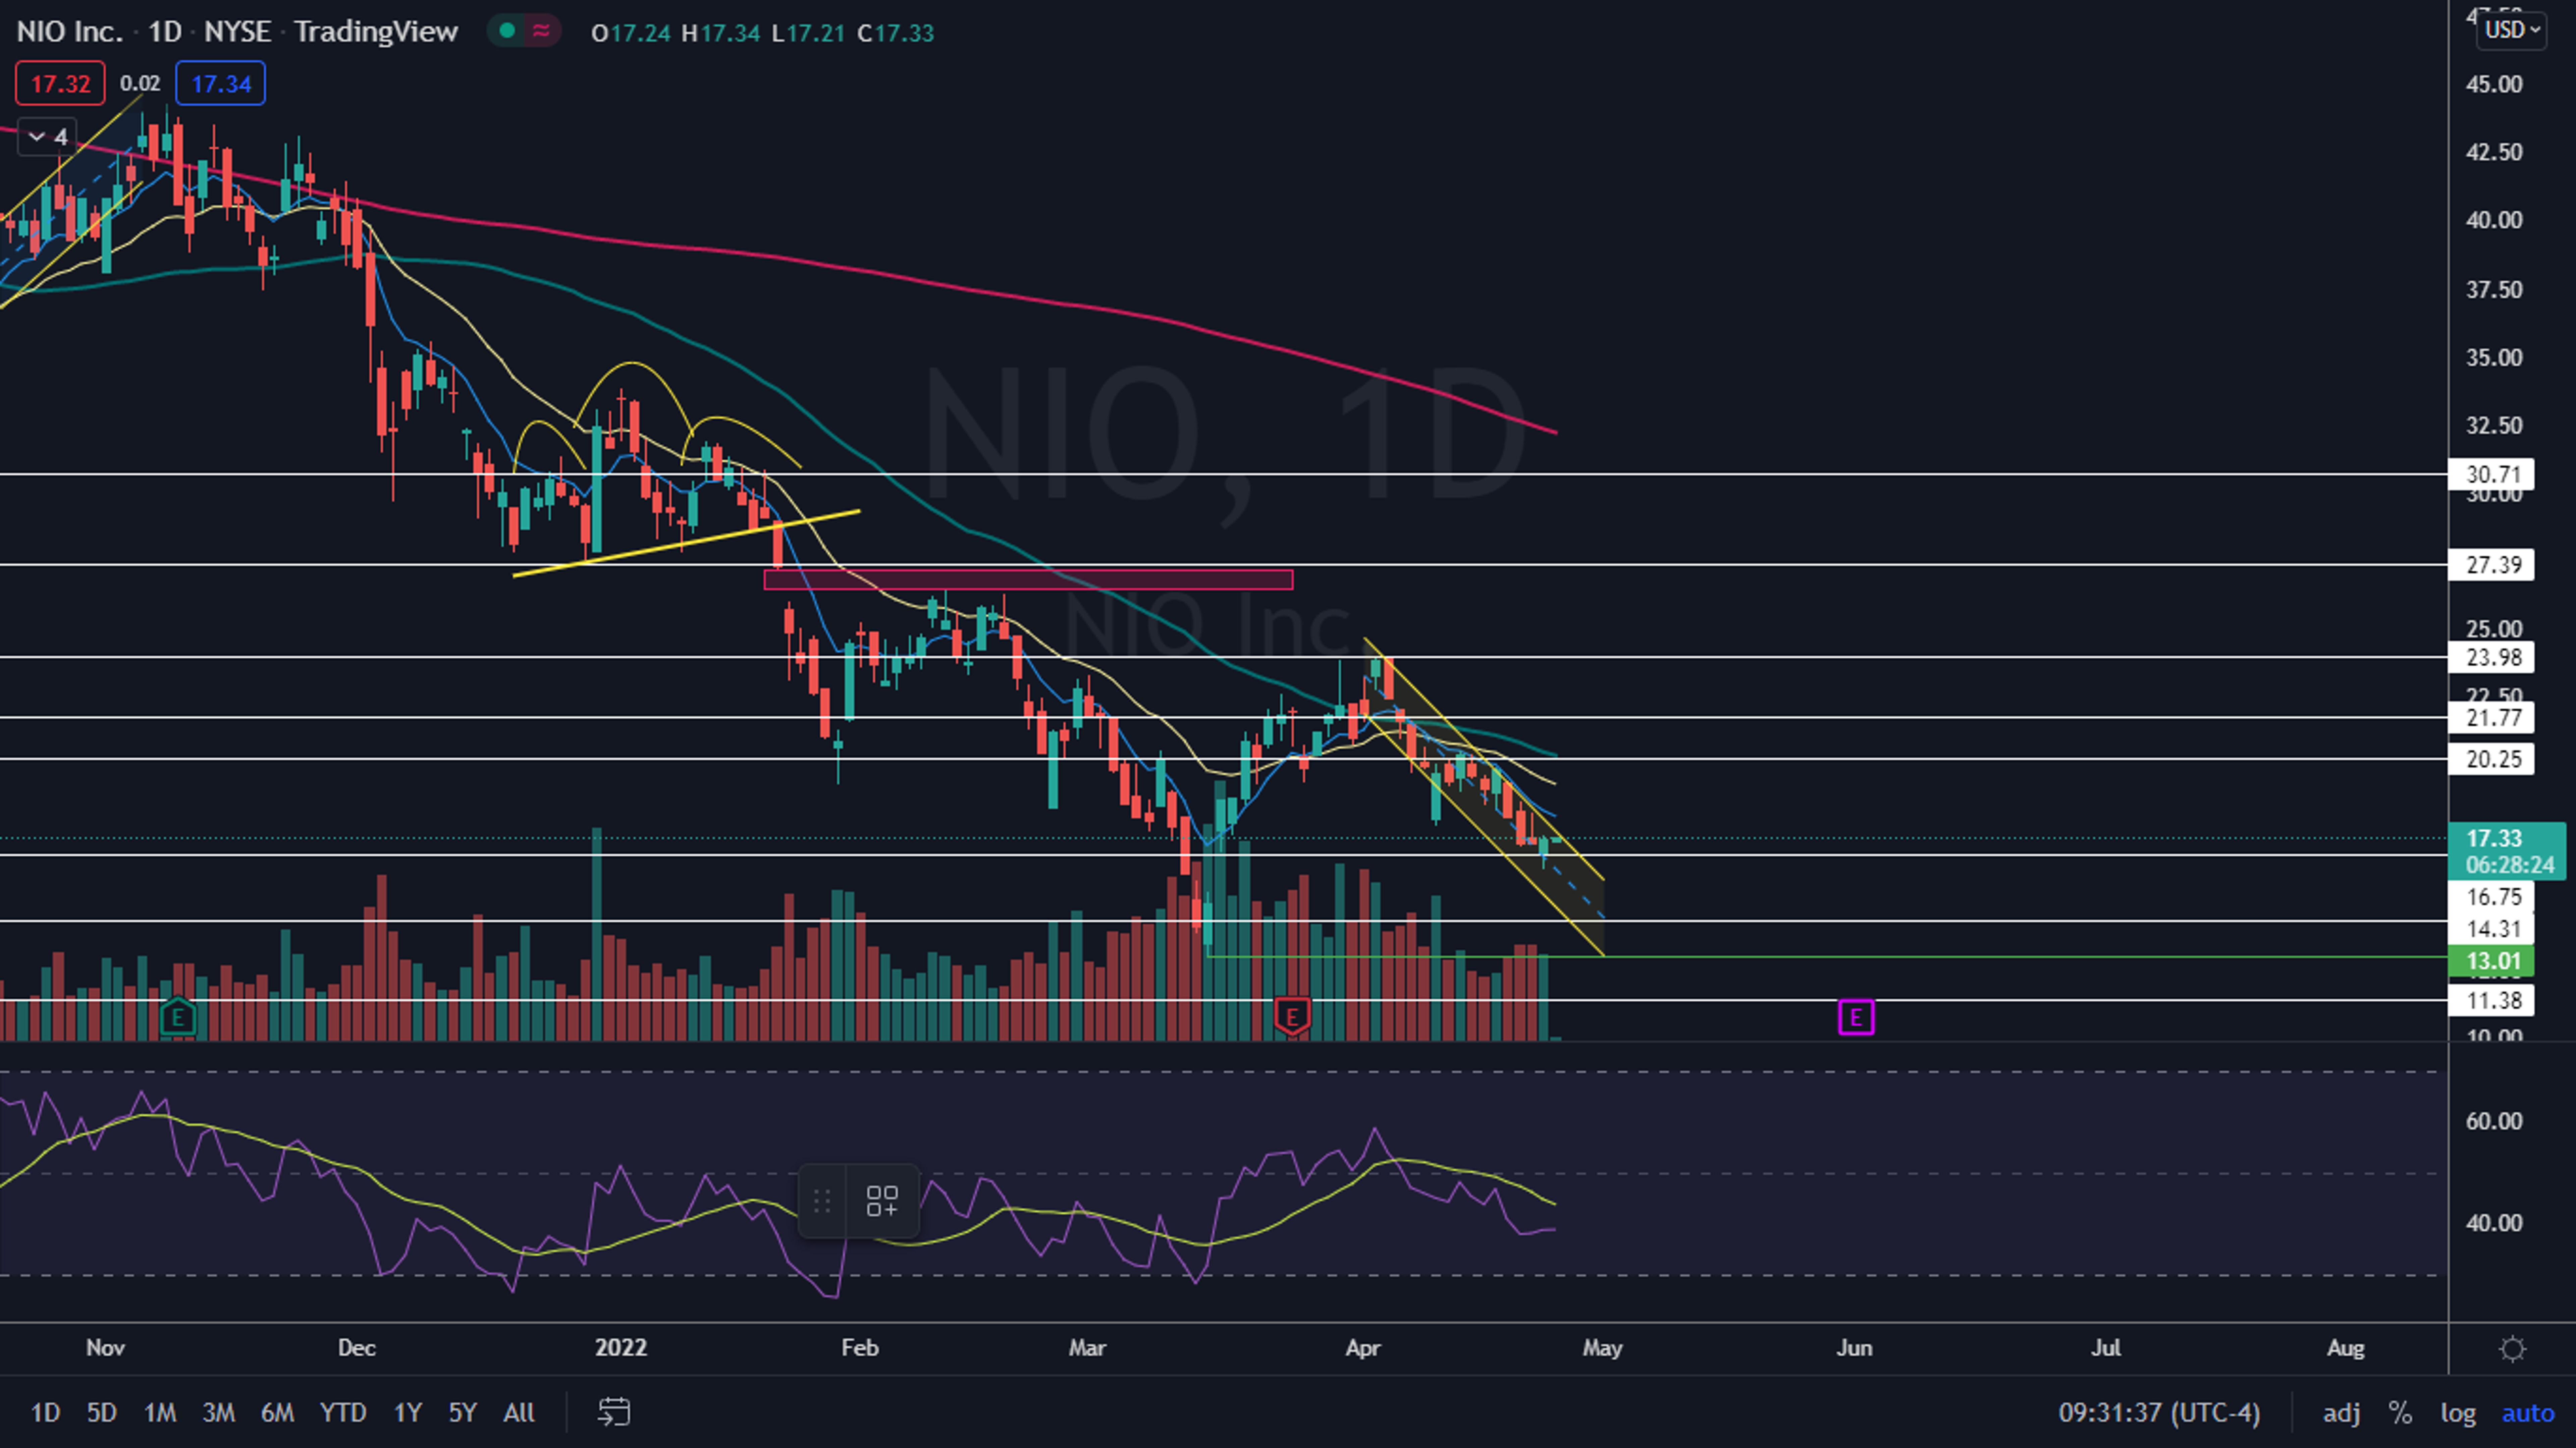
Photo courtesy of Nio.
Edge Rankings
Price Trend
© 2025 Benzinga.com. Benzinga does not provide investment advice. All rights reserved.
Trade confidently with insights and alerts from analyst ratings, free reports and breaking news that affects the stocks you care about.

