

BlackBerry, Ltd BB has created a double bottom and triple bottom patterns on the daily chart.
A double bottom pattern is a reversal indicator that shows a stock has dropped to a key support level, rebounded, back tested the level as support and is likely to rebound again. It is possible the stock may retest the level as support again, creating a triple bottom or even quadruple bottom pattern.
The formation is always identified after a security has dropped in price and is at the bottom of a downtrend, whereas a bearish double top pattern is always found in an uptrend. A spike in volume confirms the double bottom pattern was recognized, and subsequent increasing volume may indicate the stock will reverse into an uptrend.
- Aggressive bullish traders may choose to take a position when the stock’s volume spikes after the second retest of the support level. Conservative bullish traders may wait to take a position when the stock’s share price has surpassed the level of the initial rebound (the high before the second bounce from the support level).
- Bearish traders may decide to open a short position if the stock rejects at the level of the first rebound, or if the stock falls beneath the key support level it created the double bottom pattern at.
See Also: Why Is BlackBerry Attracting High Interest From Retail Investors Today?
The BlackBerry Chart: BlackBerry printed a bullish double bottom pattern on March 14 and March 15 near the $5.85 level. Between March 15 and Monday, the stock reacted to the pattern, soaring up a total of 26%.
- Although BlackBerry has made a massive run higher, the stock has not confirmed that it’s trading in a new uptrend because it hasn’t printed a higher low above the double bottom level. The stock will need to fall down to print a higher low over the coming days to confirm the trend, which could also provide a solid entry point for bullish traders.
- The stock gapped up about 3% higher to start the trading day before falling down to fill the gap, which is a positive sign because gaps on charts fill about 90% of the time and for bullish traders it’s better to not have a gap left below.
- BlackBerry has a gap above between $8.38 and $8.54, which is also likely to fill in the future.
- If the stock closes the trading day flat or at its low-of-day, BlackBerry will print a doji or inverted hammer candlestick, which could indicate the higher low may come on Tuesday.
- BlackBerry has resistance above at $7.18 and $8.77 and support below at $6.45 and $5.94.
Want direct analysis? Find me in the BZ Pro lounge! Click here for a free trial.

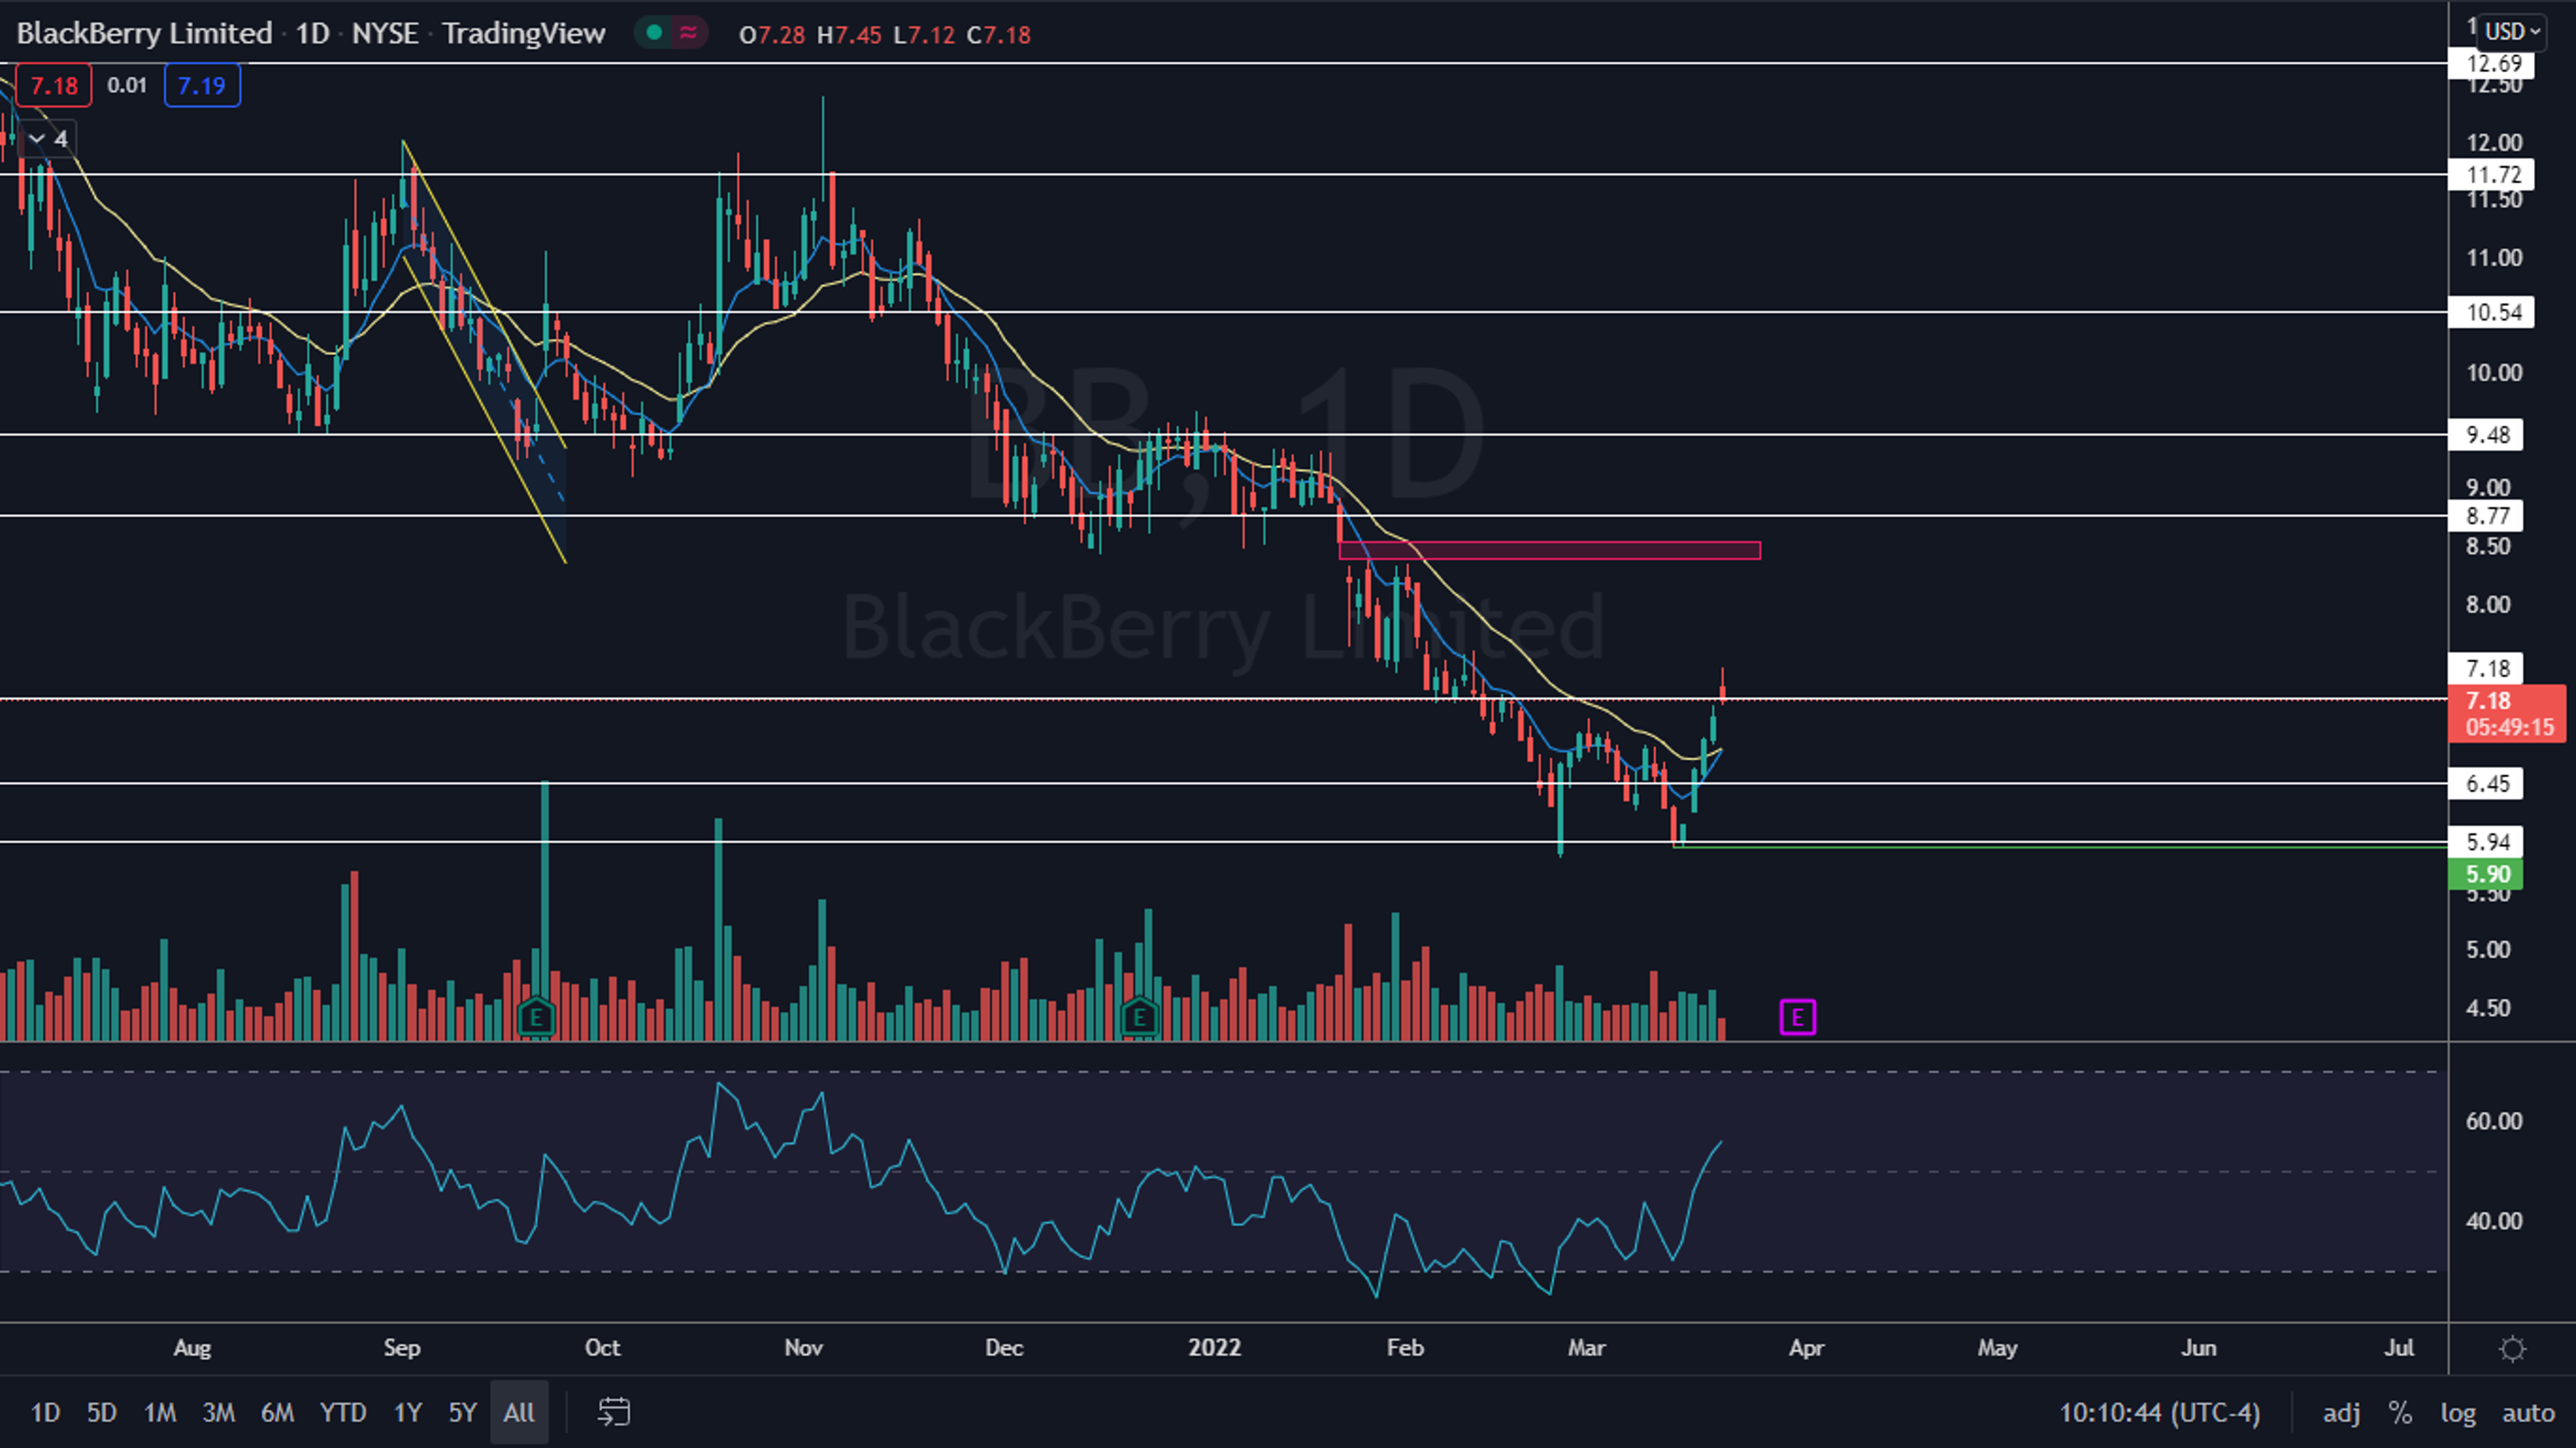
Photo: Courtesy of blackberry.com
Edge Rankings
Price Trend
© 2025 Benzinga.com. Benzinga does not provide investment advice. All rights reserved.
Trade confidently with insights and alerts from analyst ratings, free reports and breaking news that affects the stocks you care about.

