
Sometimes companies in the same industry have similar chart patterns. That's not the case with Ford Motor Company F and General Motors Company GM.
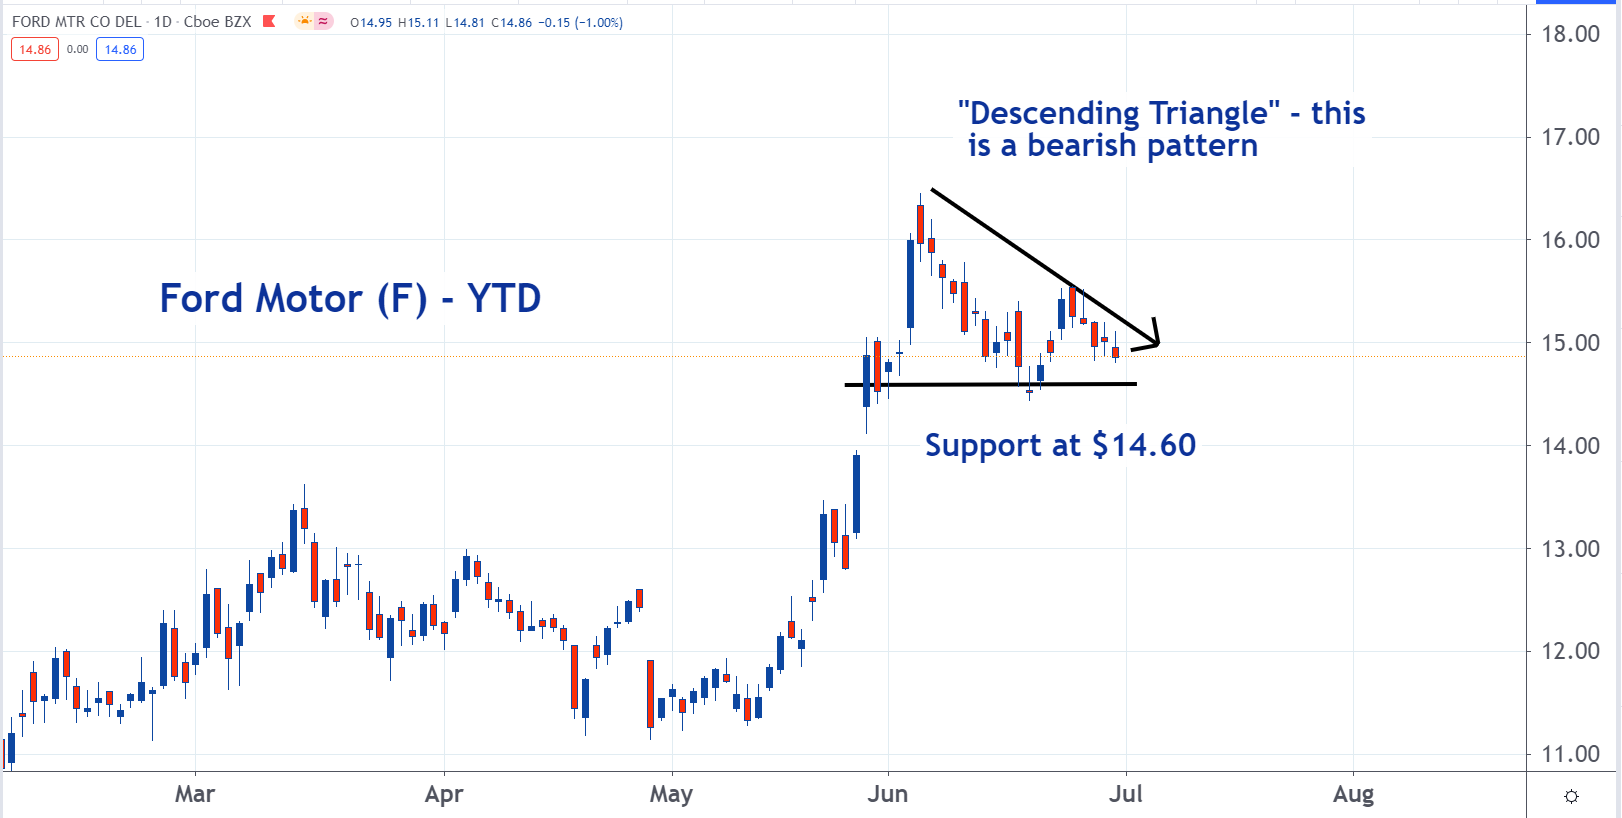
A descending triangle pattern has formed on the chart of Ford. It’s bearish because it shows that as time has passed, the sellers have become more aggressive. They've been willing to accept lower prices.
While this has happened, the buyers have been complacent. They're at the $14.60 level. They've been willing to wait for the sellers to come to them.
This combination of aggressive sellers and complacent buyers is bearish for the stock.
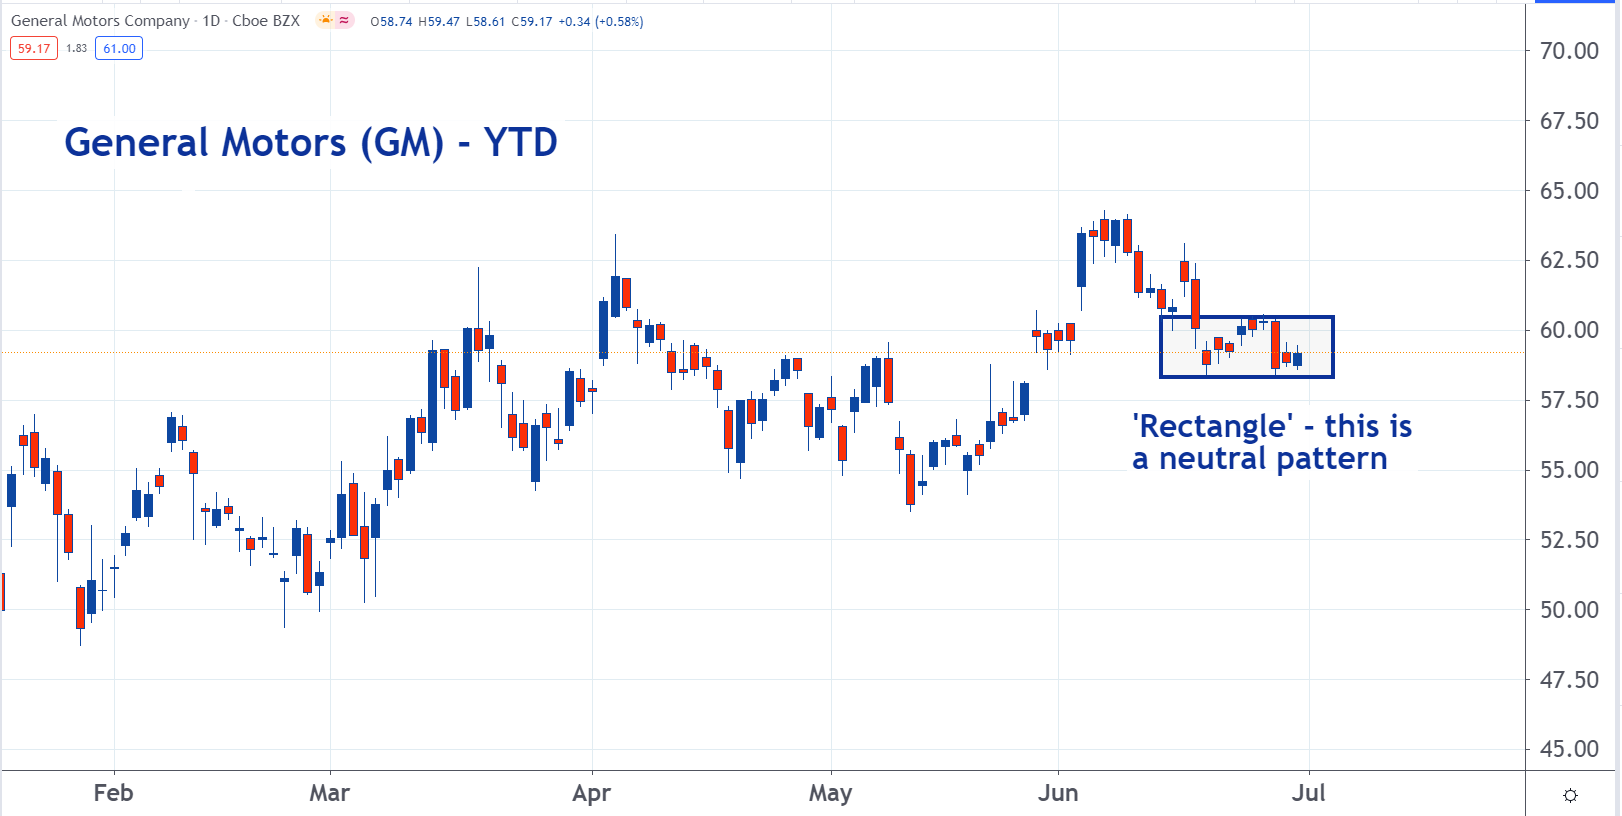
On the other hand, shares of GM appear to be in a sideways trading range or a rectangle pattern. This is a neutral pattern and suggests shares will continue to consolidate.
© 2024 Benzinga.com. Benzinga does not provide investment advice. All rights reserved.
Comments
Trade confidently with insights and alerts from analyst ratings, free reports and breaking news that affects the stocks you care about.

