There’s no doubt about it: Apple Inc. AAPL’s technical picture has been pretty bearish in the past couple of months. However, the stock is now in danger of things getting a lot worse.
Benzinga first reported about a bearish technical signal in Apple’s carts on April 29 of last year, immediately after the stock hit all-time highs of $131.29. In just over a year since that story, Apple’s shares have fallen nearly 30 percent.
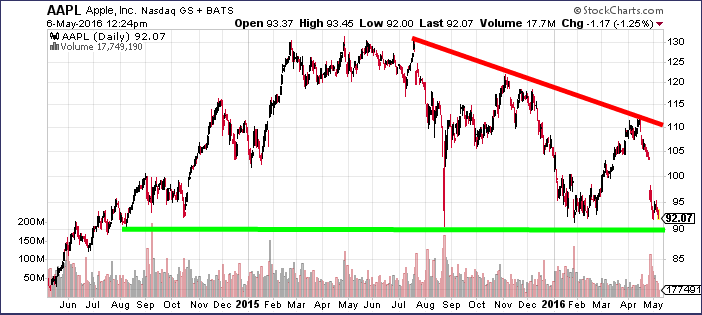
The stocks post-earnings sell-off now has it once again testing its 2015 flash crash lows of around $90. Apple has repeatedly found technical support I this region in the past couple of years, including during the early 2016 market sell-off. A breakdown below $90 would be a significantly bearish signal for Apple traders.
Related Link: Did Apple Steal This Artist's Music?
In the longer-term, however, Apple bulls remain optimistic that Apple simply got overheated and is repeating the roughly 40 percent pull-back it experienced in 2012-2013. If that’s the case, the stock could dip as low as $77 before resuming its uptrend.

Any way you dice it, a dip below $90 would be very bad news for Apple’s technical picture in the near-term. The $77 level represents at least another 16 percent downside for the stock from its current price.
Disclosure: the author holds no position in the stocks mentioned.
© 2024 Benzinga.com. Benzinga does not provide investment advice. All rights reserved.
Comments
Trade confidently with insights and alerts from analyst ratings, free reports and breaking news that affects the stocks you care about.

