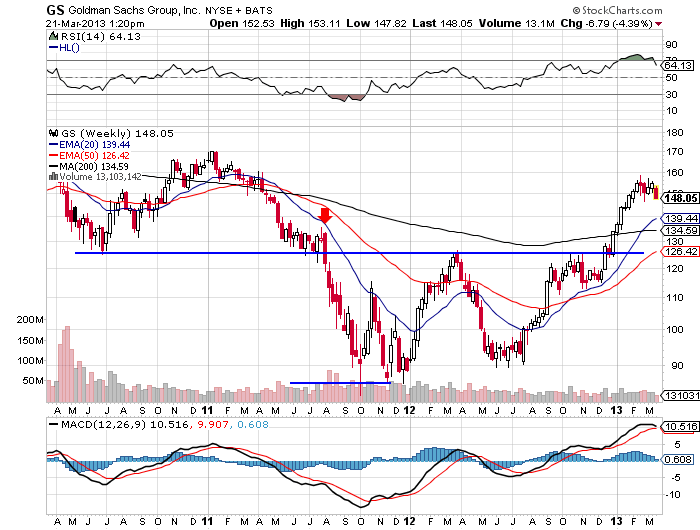
Goldman (GS) has been on a tear since its breakout over $126 in late 2012. Pullbacks are healthy in an uptrend and GS might be overdue, much like the overall market. The weekly chart has been overbought for a few weeks and not retreating out of this territory. The MACD looks to be rolling over as well.
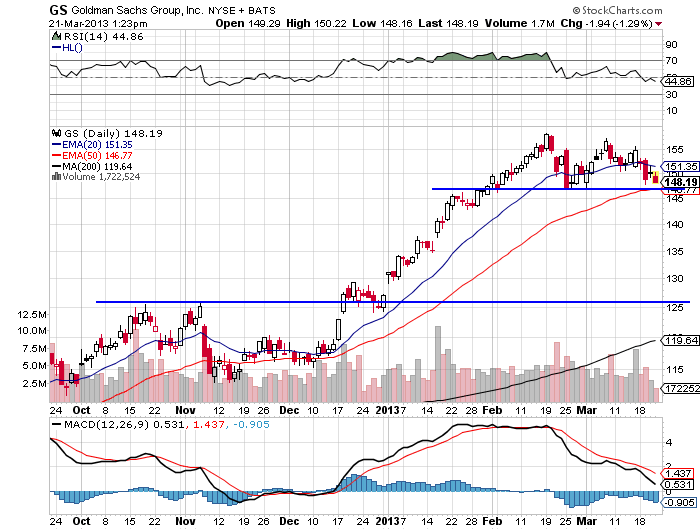
The daily chart shows strong support at $147.50-$147 area right in confluence with the 50 EMA support at $146.75. MACD has been showing strong divergence from the sideways action. If a breakdown occurs a pullback to $130-$126 area is likely.
© 2024 Benzinga.com. Benzinga does not provide investment advice. All rights reserved.
Comments
Trade confidently with insights and alerts from analyst ratings, free reports and breaking news that affects the stocks you care about.

