

Zinger Key Points
- Apple dropped back into a rising channel pattern after failing to gain momentum to the upside.
- If Apple breaks up from the channel again, the stock could reach new all-time highs.
- Ready to turn the market’s comeback into steady cash flow? Grab the top 3 stocks to buy right here.
Apple, Inc AAPL closed 0.59% lower Friday, falling back into a rising channel pattern on a pullback from its recent bull run, which Benzinga pointed out was likely to occur at the end of the first half of 2023.
The Cupertino-based company’s upcoming release of its $3,500 Vision Pro Headset could inflate bullish Apple trader’s heads, despite reports indicating the technology may cause a problem for those with a smaller cerebral encasement. Read more here...
Despite the retracement, Apple looks set to continue higher, at least for the short term, within a rising channel pattern. The pattern is bullish for the short term, but can be bearish down the road.
For bullish traders, the "trend is your friend" (until it's not) and the stock is likely to continue upwards. Aggressive traders may decide to buy the stock at the lower trend line and exit the trade at the upper trend line.
Bearish traders will want to watch for a downward break from the lower ascending trend line, on high volume, for an entry. When a stock breaks down from a rising channel, it's a powerful reversal signal and indicates a downturn is likely in the cards.
Ahead of the Federal Reserve’s decision on interest rates, volatility in the stock market may increase and traders may want to keep their heads square on their shoulders. Traders wishing to trade the volatility in the stock market can use MIAX’s SPIKES Volatility products. The products, which are traded on SPIKES Volatility Index SPIKE, track expected volatility in the SPDR S&P 500 over the next 30 days.
The Apple Chart: On Friday, Apple attempted to break up again from the rising channel pattern but rejected the upper trend line and closed under Thursday’s high-of-day. The stock has broke up from the pattern previously but failed to gain momentum to the upside, which has stalled a bigger cycle on a few occasions.
- Apple has been trading in a fairly consistent uptrend since March 2, making a series of higher highs and higher lows. The stock’s most recent higher high was formed on June 30 at $194.48 and the most recent higher low may have printed at the $189.20 mark on Thursday.
On Friday, Apple temporarily broke up broke an inside bar pattern but lacked momentum, which caused the stock to form a shooting star candlestick. If the candlestick plays out, Apple could trade lower Monday, to test the lower ascending trend line of the channel.
- Bulls want to see Apple break up from the channel on higher-than-average volume and then for bullish momentum to come in and drive the stock to a new all-time high. Bearish traders want to see Apple eventually break down from that pattern on high volume, which could suggest a longer-term downturn.
- Apple has resistance above at $194.49 and the psychologically important $200 level and support below at $189.61 and $182.94.

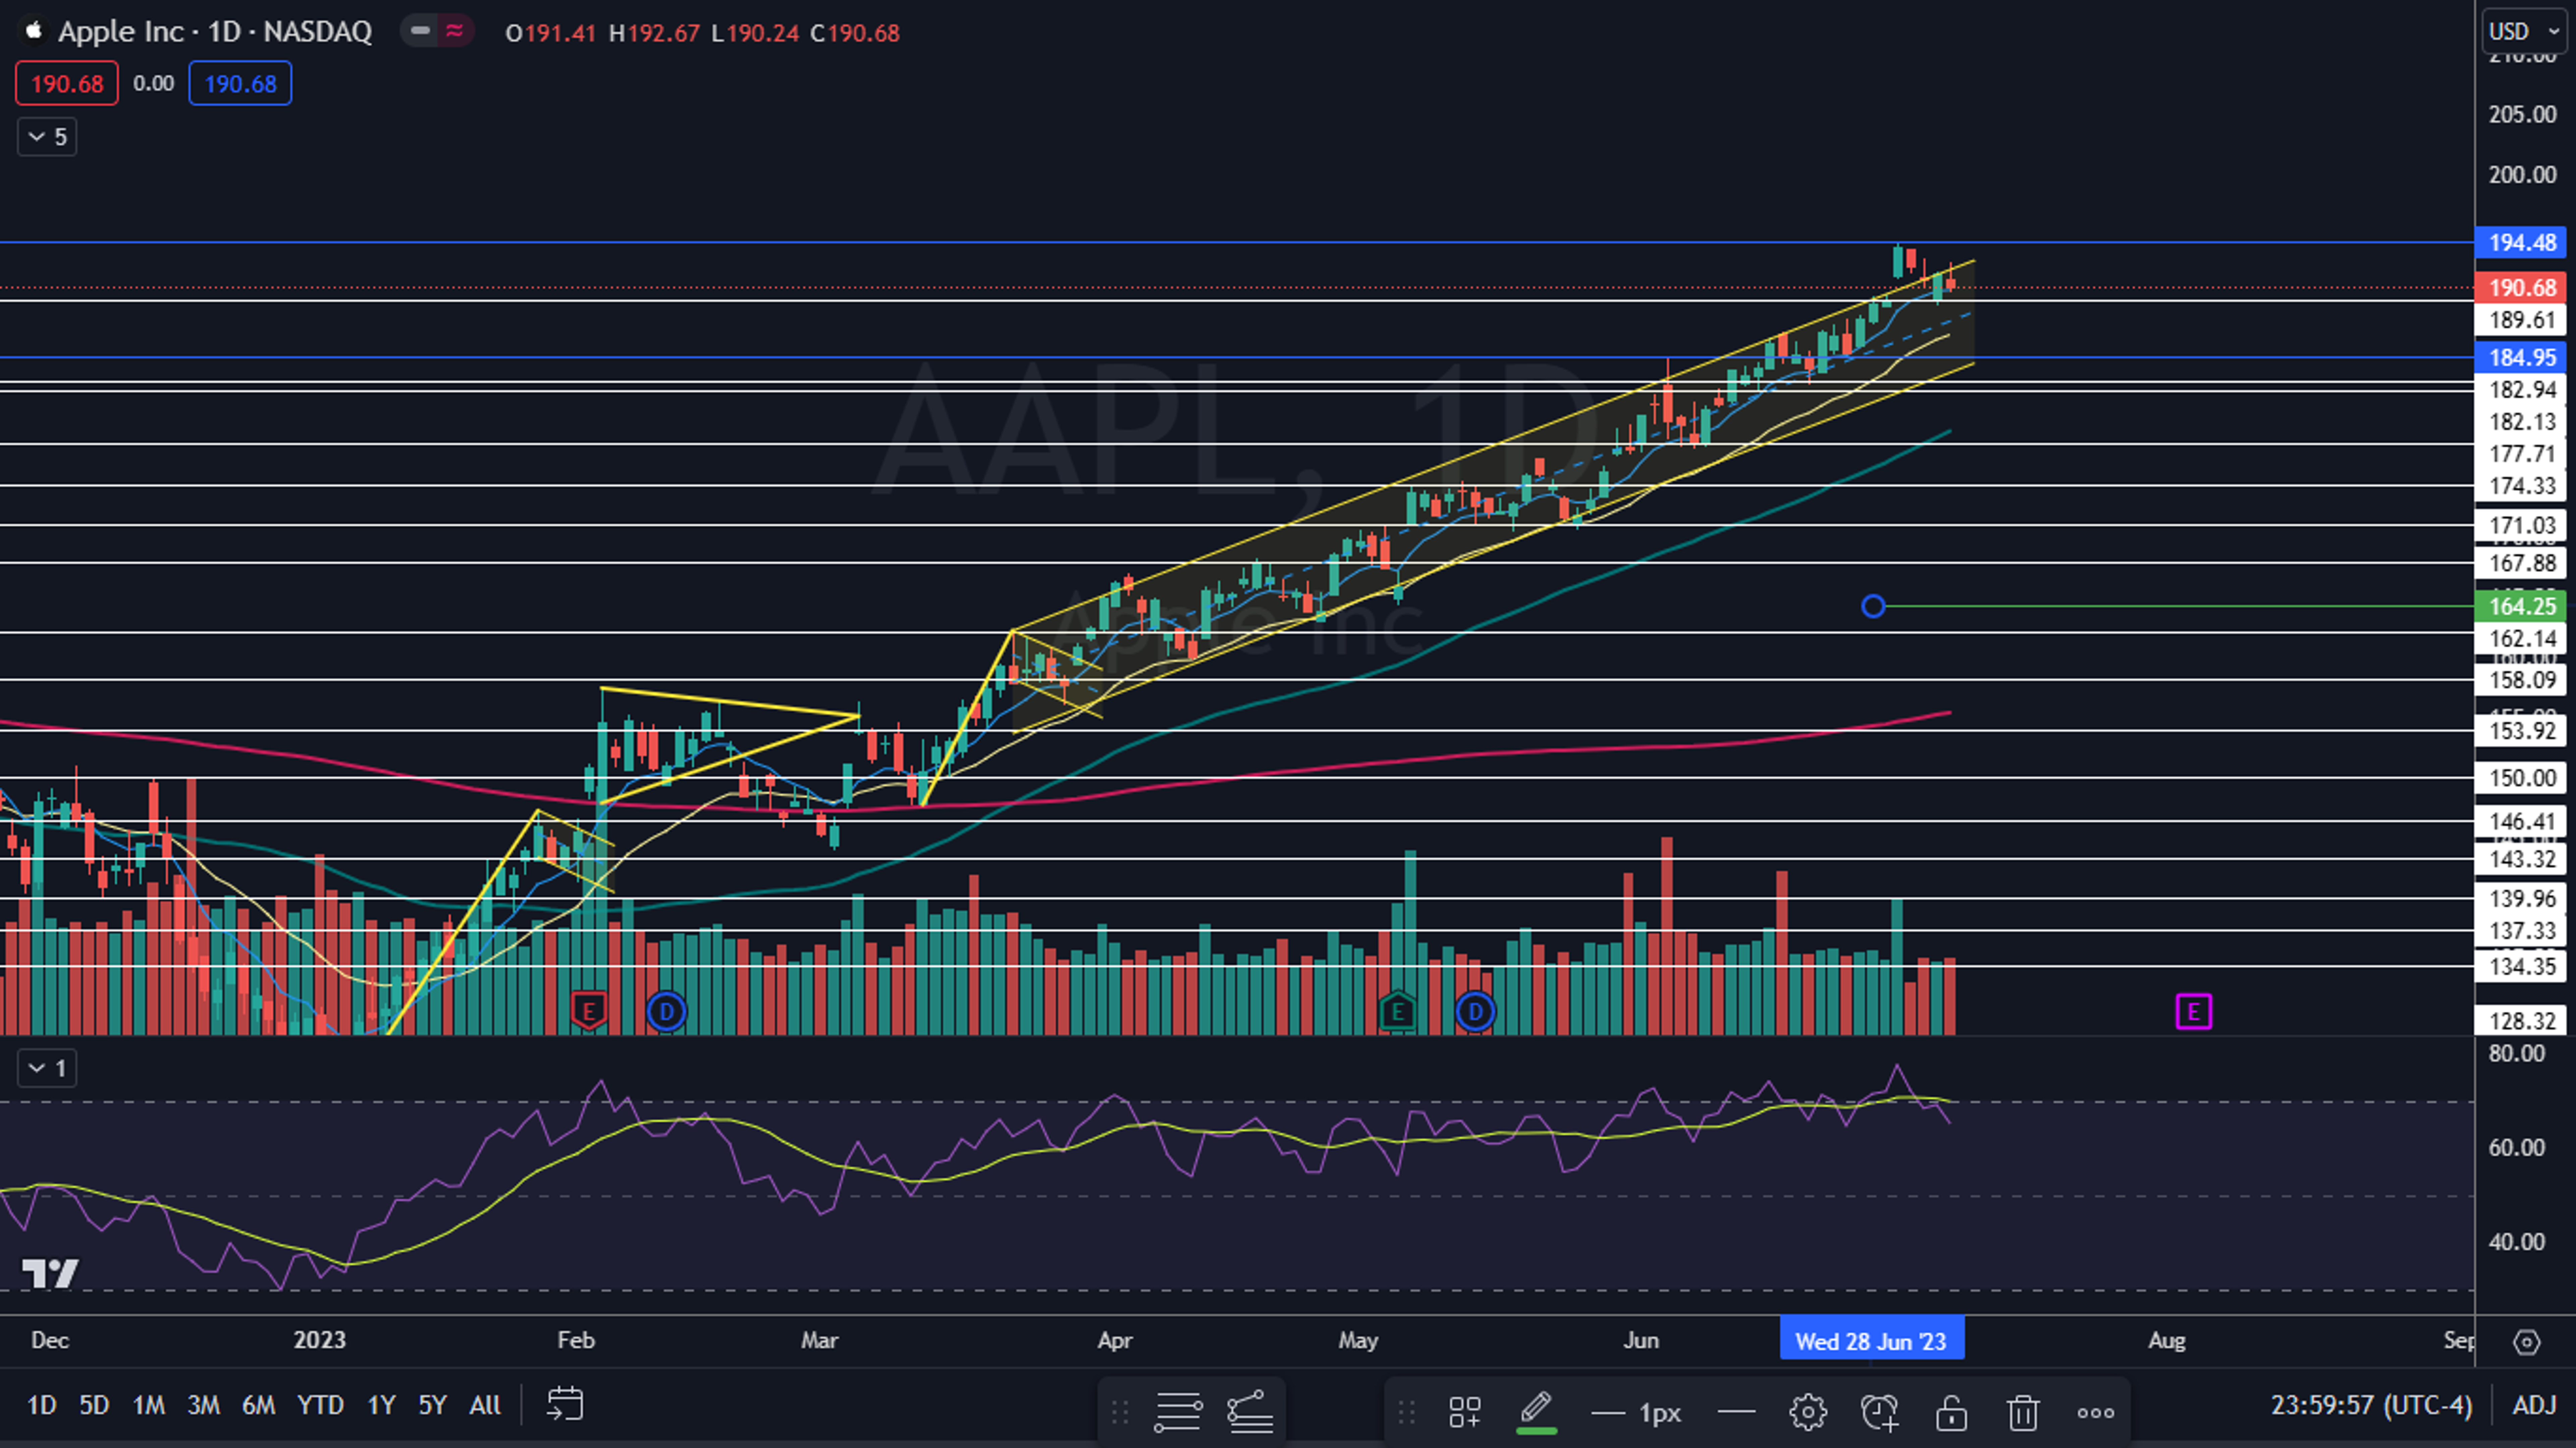
Photo via Shutterstock.
Edge Rankings
Price Trend
© 2025 Benzinga.com. Benzinga does not provide investment advice. All rights reserved.
Trade confidently with insights and alerts from analyst ratings, free reports and breaking news that affects the stocks you care about.

