


Zinger Key Points
- Nvidia is trading in an uptrend within a possible ascending triangle pattern.
- The stock will be the last mega-cap company to report earnings this season.
- Feel unsure about the market’s next move? Copy trade alerts from Matt Maley—a Wall Street veteran who consistently finds profits in volatile markets. Claim your 7-day free trial now.
Nvidia Corporation NVDA was trading flat Friday morning in continued consolidation, in tandem with the general market, which saw the S$P 500 edging slightly higher but on lower-than-average volume on smaller time frames.
Nvidia will be the last of the big-tech companies to report quarterly earnings when the company prints its results on May 24. With Nvidia being one of the most bullish mega-cap stocks so far over the course of 2023, having risen 99% since the beginning of the year, the company’s earnings could push Nvidia back toward all-time highs or stomp out the move higher and set the stock into a long-term retracement.
For now, Nvidia is trading in an inside bar pattern, which is helping to consolidate the large run higher. An inside bar pattern indicates a period of consolidation and is usually followed by a continuation move in the direction of the trend.
An inside bar pattern has more validity on larger time frames (four-hour chart or larger). The pattern has a minimum of two candlesticks and consists of a mother bar (the first candlestick in the pattern) followed by one or more subsequent candles. The subsequent candle(s) must be completely inside the range of the mother bar and each is called an "inside bar."
A double, or triple inside bar can be more powerful than a single inside bar. After the break of an inside bar pattern, traders want to watch for high volume for confirmation the pattern was recognized.
Want direct analysis? Find me in the BZ Pro lounge! Click here for a free trial.
The Nvidia Chart: Nvidia’s inside bar pattern lean bullish because the stock has been trading in a strong uptrend. Traders can watch for the stock to eventually break up or down from Thursday’s mother bar on higher-than-average volume to determine future direction.
- The stock is also trading in a strong and consistent uptrend, making a series of higher highs and higher lows. Nvidia’s most recent higher high was formed on Monday at $292.20 and the most recent higher low was printed at the $272.40 mark on May 4. The stock is also trading in a possible ascending triangle pattern.
- If Nvidia breaks up from the mother bar later on Friday or on Monday, Thursday’s low-of-day will serve as the next higher low within the uptrend patter. If Nvidia break down from Thursday’s range, bullish traders will want to see the stock print a bullish reversal candlestick above $273.
- Bearish traders want to see big bearish volume come in and break Nvidia down from the triangle pattern, which could signal a longer-term reversal to the downside is on the horizon. If that happens, Nvidia could form a lower low and negate its uptrend.
- Nvidia has resistance above at $288 and $314 and support below at $272.29 and $252.59.

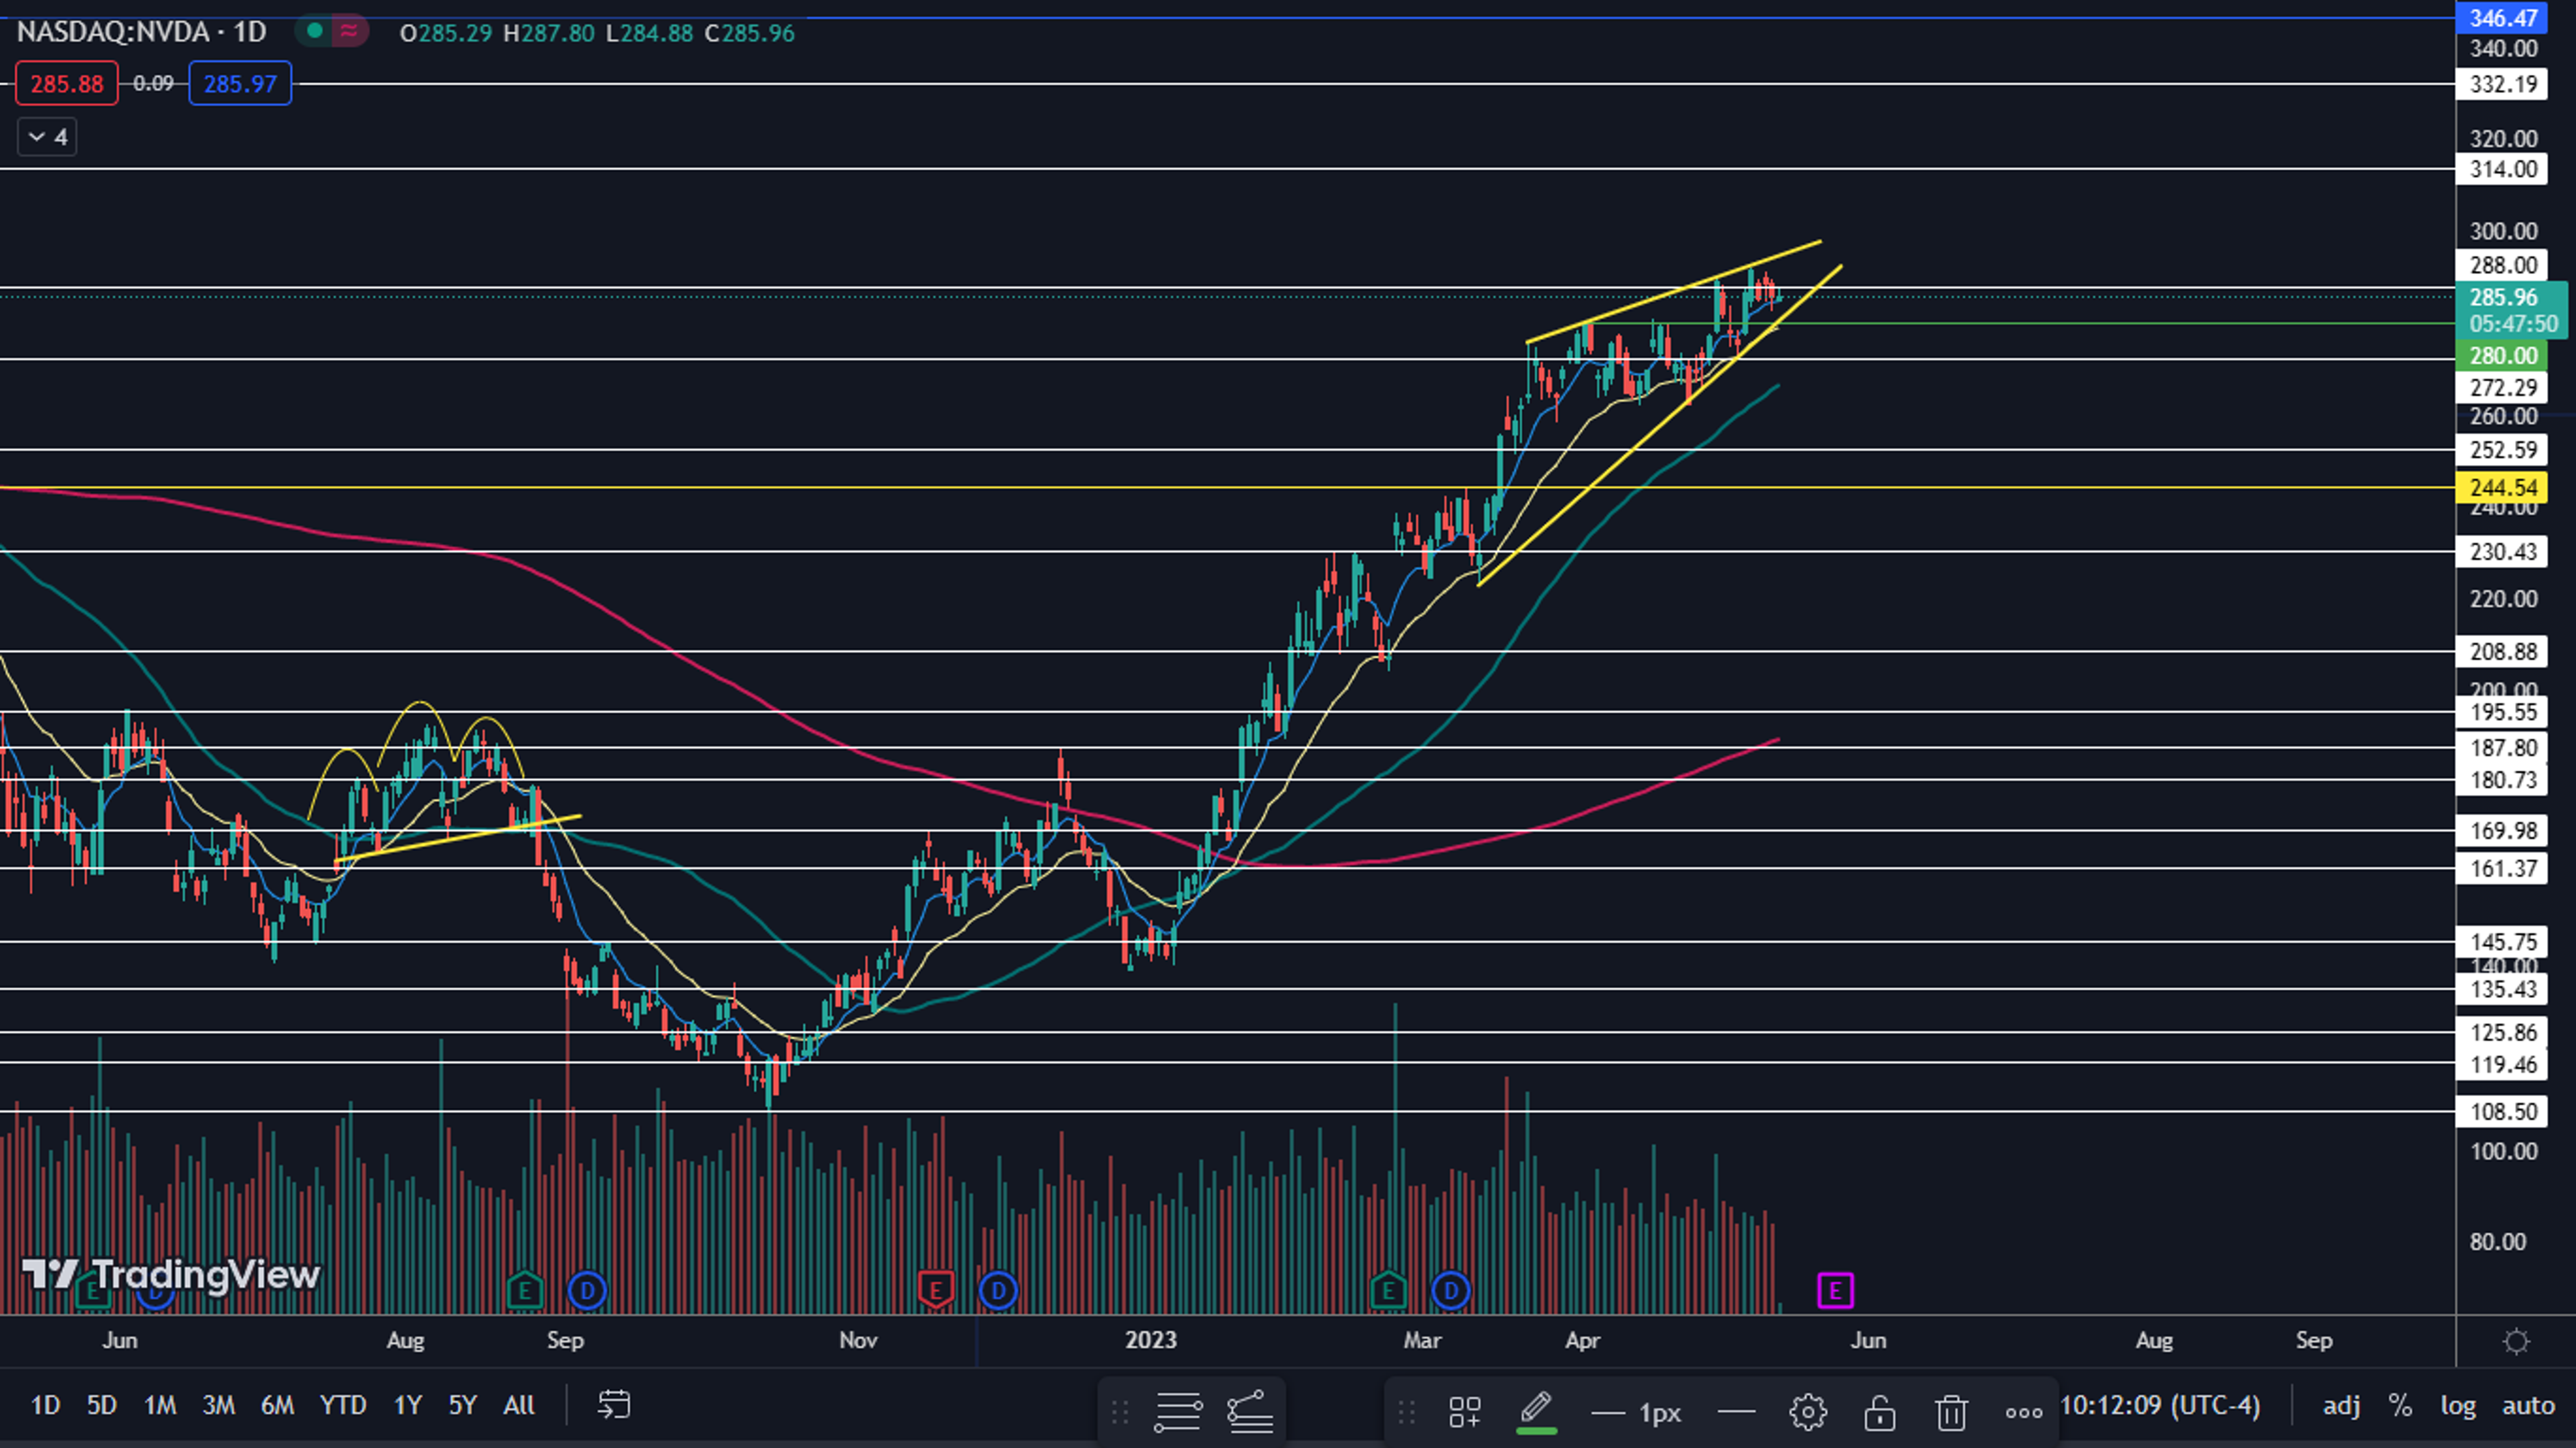
Photo via Shutterstock.
Edge Rankings
Price Trend
© 2025 Benzinga.com. Benzinga does not provide investment advice. All rights reserved.
Trade confidently with insights and alerts from analyst ratings, free reports and breaking news that affects the stocks you care about.

