Benzinga

España
Italia
대한민국
日本
Français
Benzinga Edge
Benzinga Research
Benzinga Pro

  • Get Benzinga Pro
  • Data & APIs
  • Events
  • Premarket
  • Advertise
Contribute
España
Italia
대한민국
日本
Français

Benzinga

  • Premium Services
  • Financial News
    Latest
    Earnings
    Guidance
    Dividends
    M&A
    Buybacks
    Interviews
    Management
    Offerings
    IPOs
    Insider Trades
    Biotech/FDA
    Politics
    Healthcare
    Small-Cap
  • Markets
    Pre-Market
    After Hours
    Movers
    ETFs
    Options
    Cryptocurrency
    Commodities
    Bonds
    Futures
    Mining
    Real Estate
    Volatility
  • Ratings
    Analyst Color
    Downgrades
    Upgrades
    Initiations
    Price Target
  • Investing Ideas
    Trade Ideas
    Long Ideas
    Short Ideas
    Technicals
    Analyst Ratings
    Analyst Color
    Latest Rumors
    Whisper Index
    Stock of the Day
    Best Stocks & ETFs
    Best Penny Stocks
    Best S&P 500 ETFs
    Best Swing Trade Stocks
    Best Blue Chip Stocks
    Best High-Volume Penny Stocks
    Best Small Cap ETFs
    Best Stocks to Day Trade
    Best REITs
  • Money
    Investing
    Cryptocurrency
    Mortgage
    Insurance
    Yield
    Personal Finance
    Forex
    Startup Investing
    Real Estate Investing
    Prop Trading
    Credit Cards
    Stock Brokers
Research
My Stocks
Tools
Free Benzinga Pro Trial
Calendars
Analyst Ratings Calendar
Conference Call Calendar
Dividend Calendar
Earnings Calendar
Economic Calendar
FDA Calendar
Guidance Calendar
IPO Calendar
M&A Calendar
Unusual Options Activity Calendar
SPAC Calendar
Stock Split Calendar
Trade Ideas
Stock Reports
Insider Trades
Trade Idea Feed
Analyst Ratings
Unusual Options Activity
Heatmaps
Free Newsletter
Government Trades
Perfect Stock Portfolio
Easy Income Portfolio
Short Interest
Most Shorted
Largest Increase
Largest Decrease
Calculators
Margin Calculator
Forex Profit Calculator
100x Options Profit Calculator
Screeners
Stock Screener
Top Momentum Stocks
Top Quality Stocks
Top Value Stocks
Top Growth Stocks
Compare Best Stocks
Best Momentum Stocks
Best Quality Stocks
Best Value Stocks
Best Growth Stocks
Connect With Us
facebookinstagramlinkedintwitteryoutubeblueskymastodon
About Benzinga
  • About Us
  • Careers
  • Advertise
  • Contact Us
Market Resources
  • Advanced Stock Screener Tools
  • Options Trading Chain Analysis
  • Comprehensive Earnings Calendar
  • Dividend Investor Calendar and Alerts
  • Economic Calendar and Market Events
  • IPO Calendar and New Listings
  • Market Outlook and Analysis
  • Wall Street Analyst Ratings and Targets
Trading Tools & Education
  • Benzinga Pro Trading Platform
  • Options Trading Strategies and News
  • Stock Market Trading Ideas and Analysis
  • Technical Analysis Charts and Indicators
  • Fundamental Analysis and Valuation
  • Day Trading Guides and Strategies
  • Live Investor Events
  • Pre-market Stock Analysis and News
  • Cryptocurrency Market Analysis and News
Ring the Bell

A newsletter built for market enthusiasts by market enthusiasts. Top stories, top movers, and trade ideas delivered to your inbox every weekday before and after the market closes.

  • Terms & Conditions
  • Do Not Sell My Personal Data/Privacy Policy
  • Disclaimer
  • Service Status
  • Sitemap
© 2026 Benzinga | All Rights Reserved
December 2, 2022 1:56 PM 2 min read

Amazon Nears Break Of This Consolidation Pattern: Which Way Is The Stock Headed Next?

by Melanie Schaffer Benzinga Editor
Follow
FlipboardIcon version of the Flipboard logo

Amazon.com, Inc. (NASDAQ:AMZN) gapped down about 1% to start Friday’s trading session and after some slight volatility in the morning, the stock settled to trade flat just under the $95 level.

Read about Amazon's downsizing plans here

Despite the S&P 500 trading higher in an uptrend since Oct. 13, Amazon, which makes up 3.7% of the ETF, has failed to significantly rebound.

A bearish reaction to the e-commerce and streaming giant’s Oct. 27 third-quarter earnings print caused Amazon to plunge to a new 31-month low of $85.87. Although the stock has rebounded slightly from that level, the psychologically important $100 level has acted as strong resistance, holding Amazon back from making any big move north.

Amazon has also been trading on declining volume since its last earnings print, which indicates the stock is running out of both buyers and sellers as it consolidates. Declining volume often precedes a large increase in trading volume, which helps break a security up or down from its current pattern.

Want direct analysis? Find me in the BZ Pro lounge! Click here for a free trial.

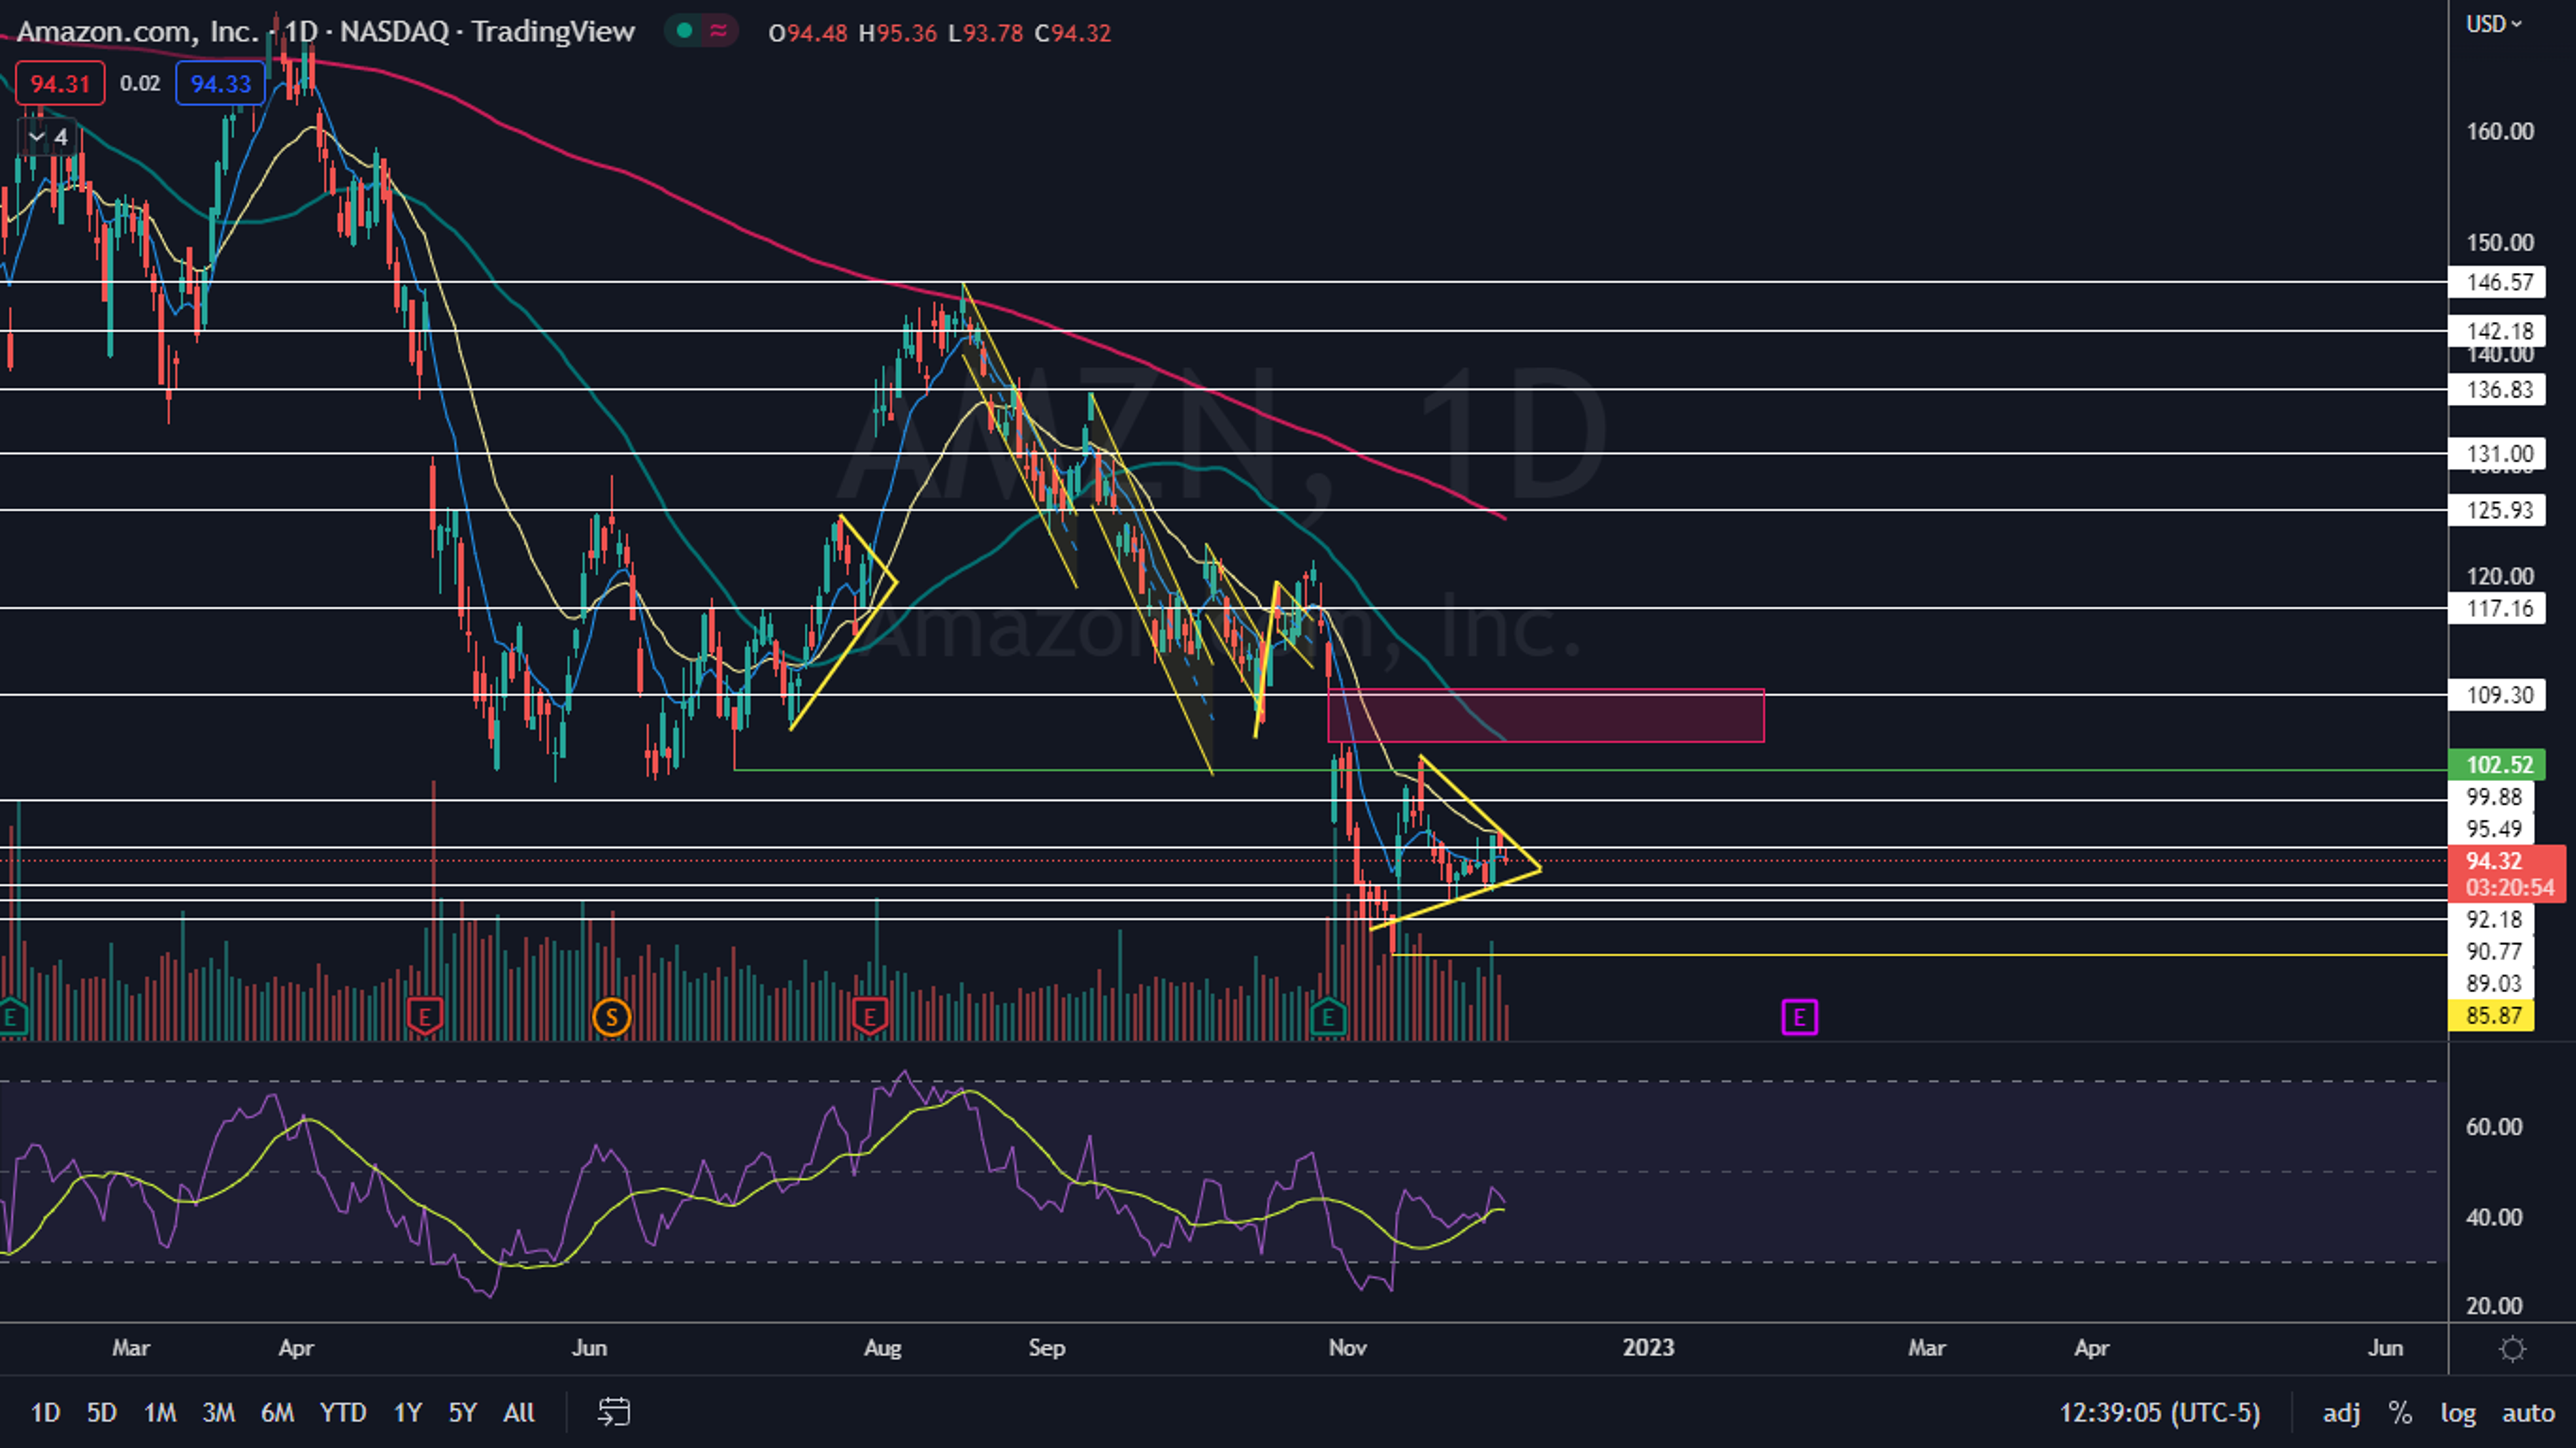
The Amazon Chart: Amazon’s sideways consolidation is taking place within a triangle pattern, where the stock has been making a series of lower highs and higher lows. Amazon is set to reach the apex of the triangle on Dec. 9 and if the pattern is recognized, traders can watch for the stock to break up or down from the triangle on higher-than-average volume.

Read Next: What Bear Market? The Dow Is Officially In A Bull Market And The S&P 500 May Follow Suit

Market News and Data brought to you by Benzinga APIs

© 2026 Benzinga.com. Benzinga does not provide investment advice. All rights reserved.

To add Benzinga News as your preferred source on Google, click here.


Posted In:
Long IdeasShort IdeasTechnicalsTop StoriesTrading Idease-commerce
AMZN Logo
AMZNAmazon.com Inc
$212.75-0.74%
Overview
  • If Amazon breaks down from the pattern, bullish traders will want to see if Amazon forms a reversal candlestick at the $85.87 low, which would cause a bullish double-bottom pattern to form. If that happens, Amazon could bounce significantly and possibly form a new uptrend.
  • If Amazon breaks up bullishly from the triangle, a new uptrend will confirm. If that happens, Amazon could rally to fill an upper gap that exists between $104.87 and $109.77.
  • Bearish traders want to see Amazon break down from the triangle and form a new 52-week low. If that takes place a longer-term downtrend could be in the cards.
  • Amazon has resistance above at $95.49 and $99.88 and support below at $92.18 and $90.77.
AMZN Logo
AMZNAmazon.com Inc
$212.75-0.74%
Overview
Comments
Loading...