
FuelCell Energy, Inc (NASDAQ:FCEL), Nike, Inc (NYSE:NKE) and SoFi Technologies, Inc (NASDAQ:SOFI) have all settled into bullish flag patterns on the daily chart. The bull flag pattern is created with a sharp rise higher forming the pole, which is then followed by a consolidation pattern that brings the stock either lower between a channel with parallel lines or into a small tightening triangle.
- For bearish traders, the "trend is your friend" (until it's not), and the stock may continue downwards within the following flag for a short period of time. Aggressive traders may decide to short the stock at the upper trendline and exit the trade at the lower trendline.
- Bullish traders will want to watch for a break up from the upper descending trendline of the flag formation, on high volume, for an entry. When a stock breaks up from a bull flag pattern, the measured move higher is equal to the length of the pole and should be added to the lowest price within the flag.
A bull flag is negated when a stock closes a trading day below the lower trendline of the flag pattern or if the flag falls more than 50% down the length of the pole.
See Also: Five Common Day Trading Patterns To Know
The FuelCell Chart: FuelCell shot up over 50% higher between Oct. 6 and Oct. 18 and then entered into consolidation in the form of a bull flag. The consolidation is needed to drop FuelCell's relative strength index, which hit an uncomfortable 73% on Monday. FuelCell's flag is being formed in a tightening triangle pattern and bulls can watch for a break of the upper descending trendline before Oct. 25.

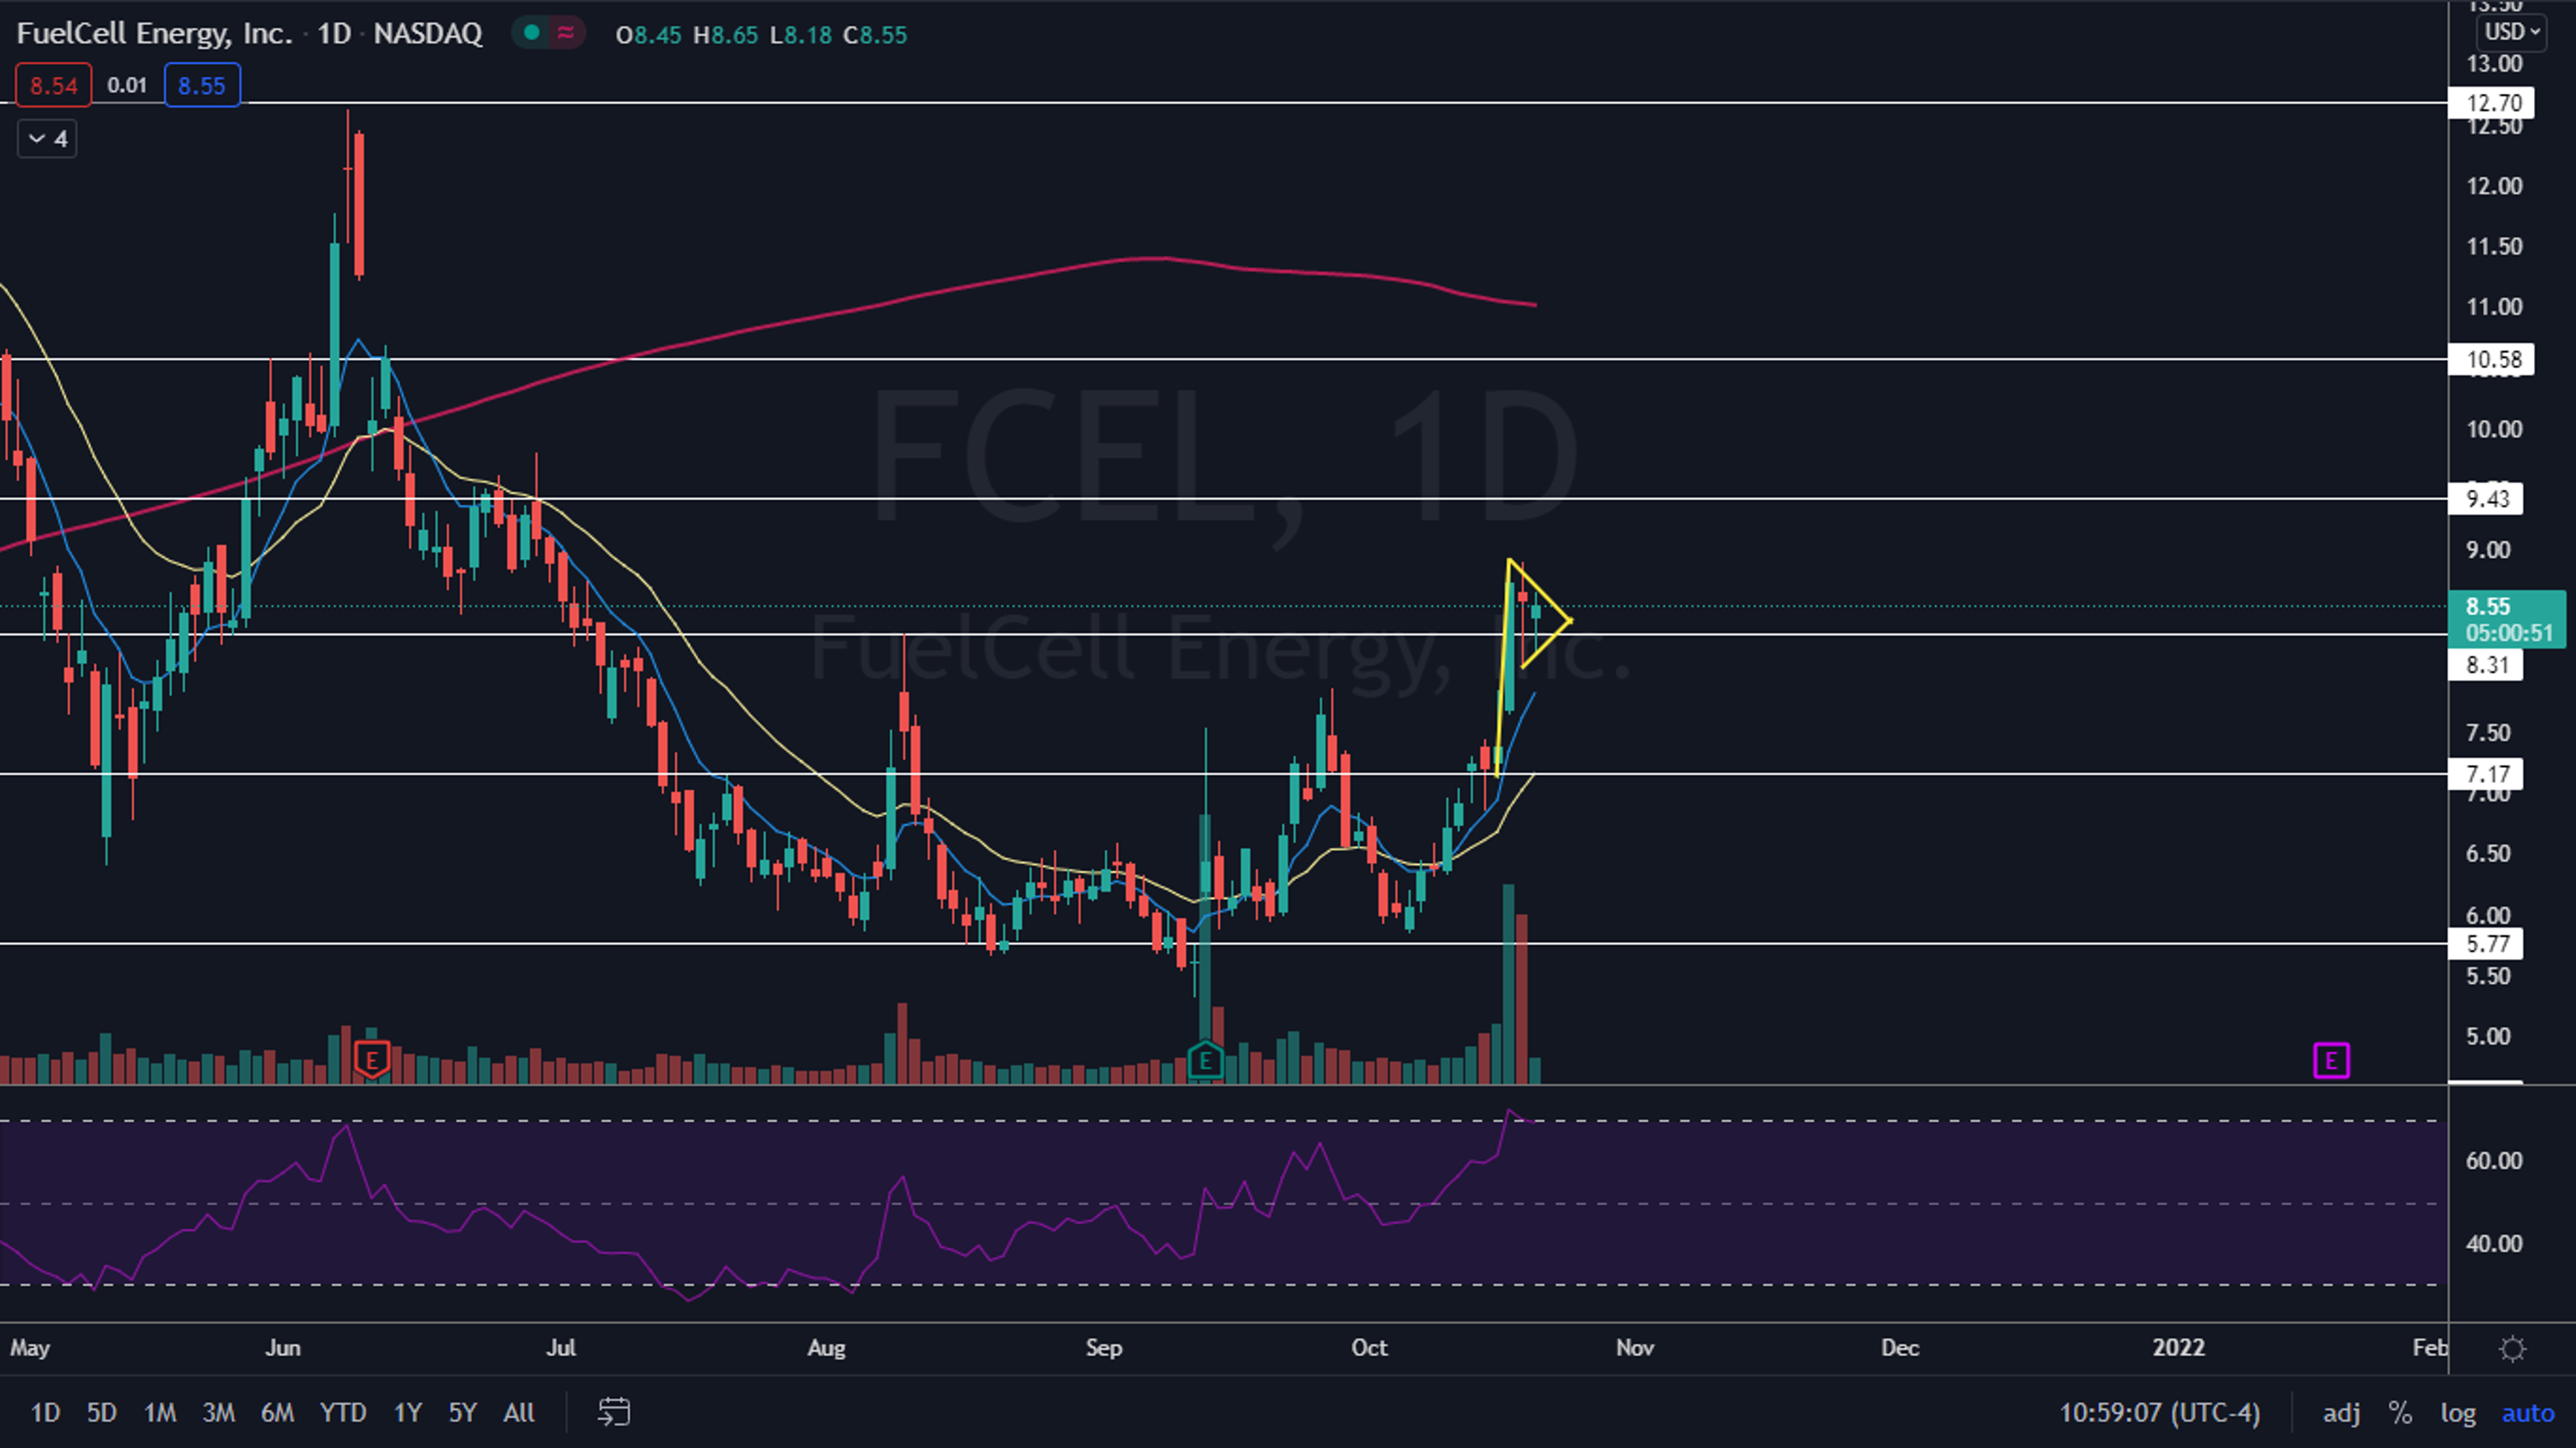
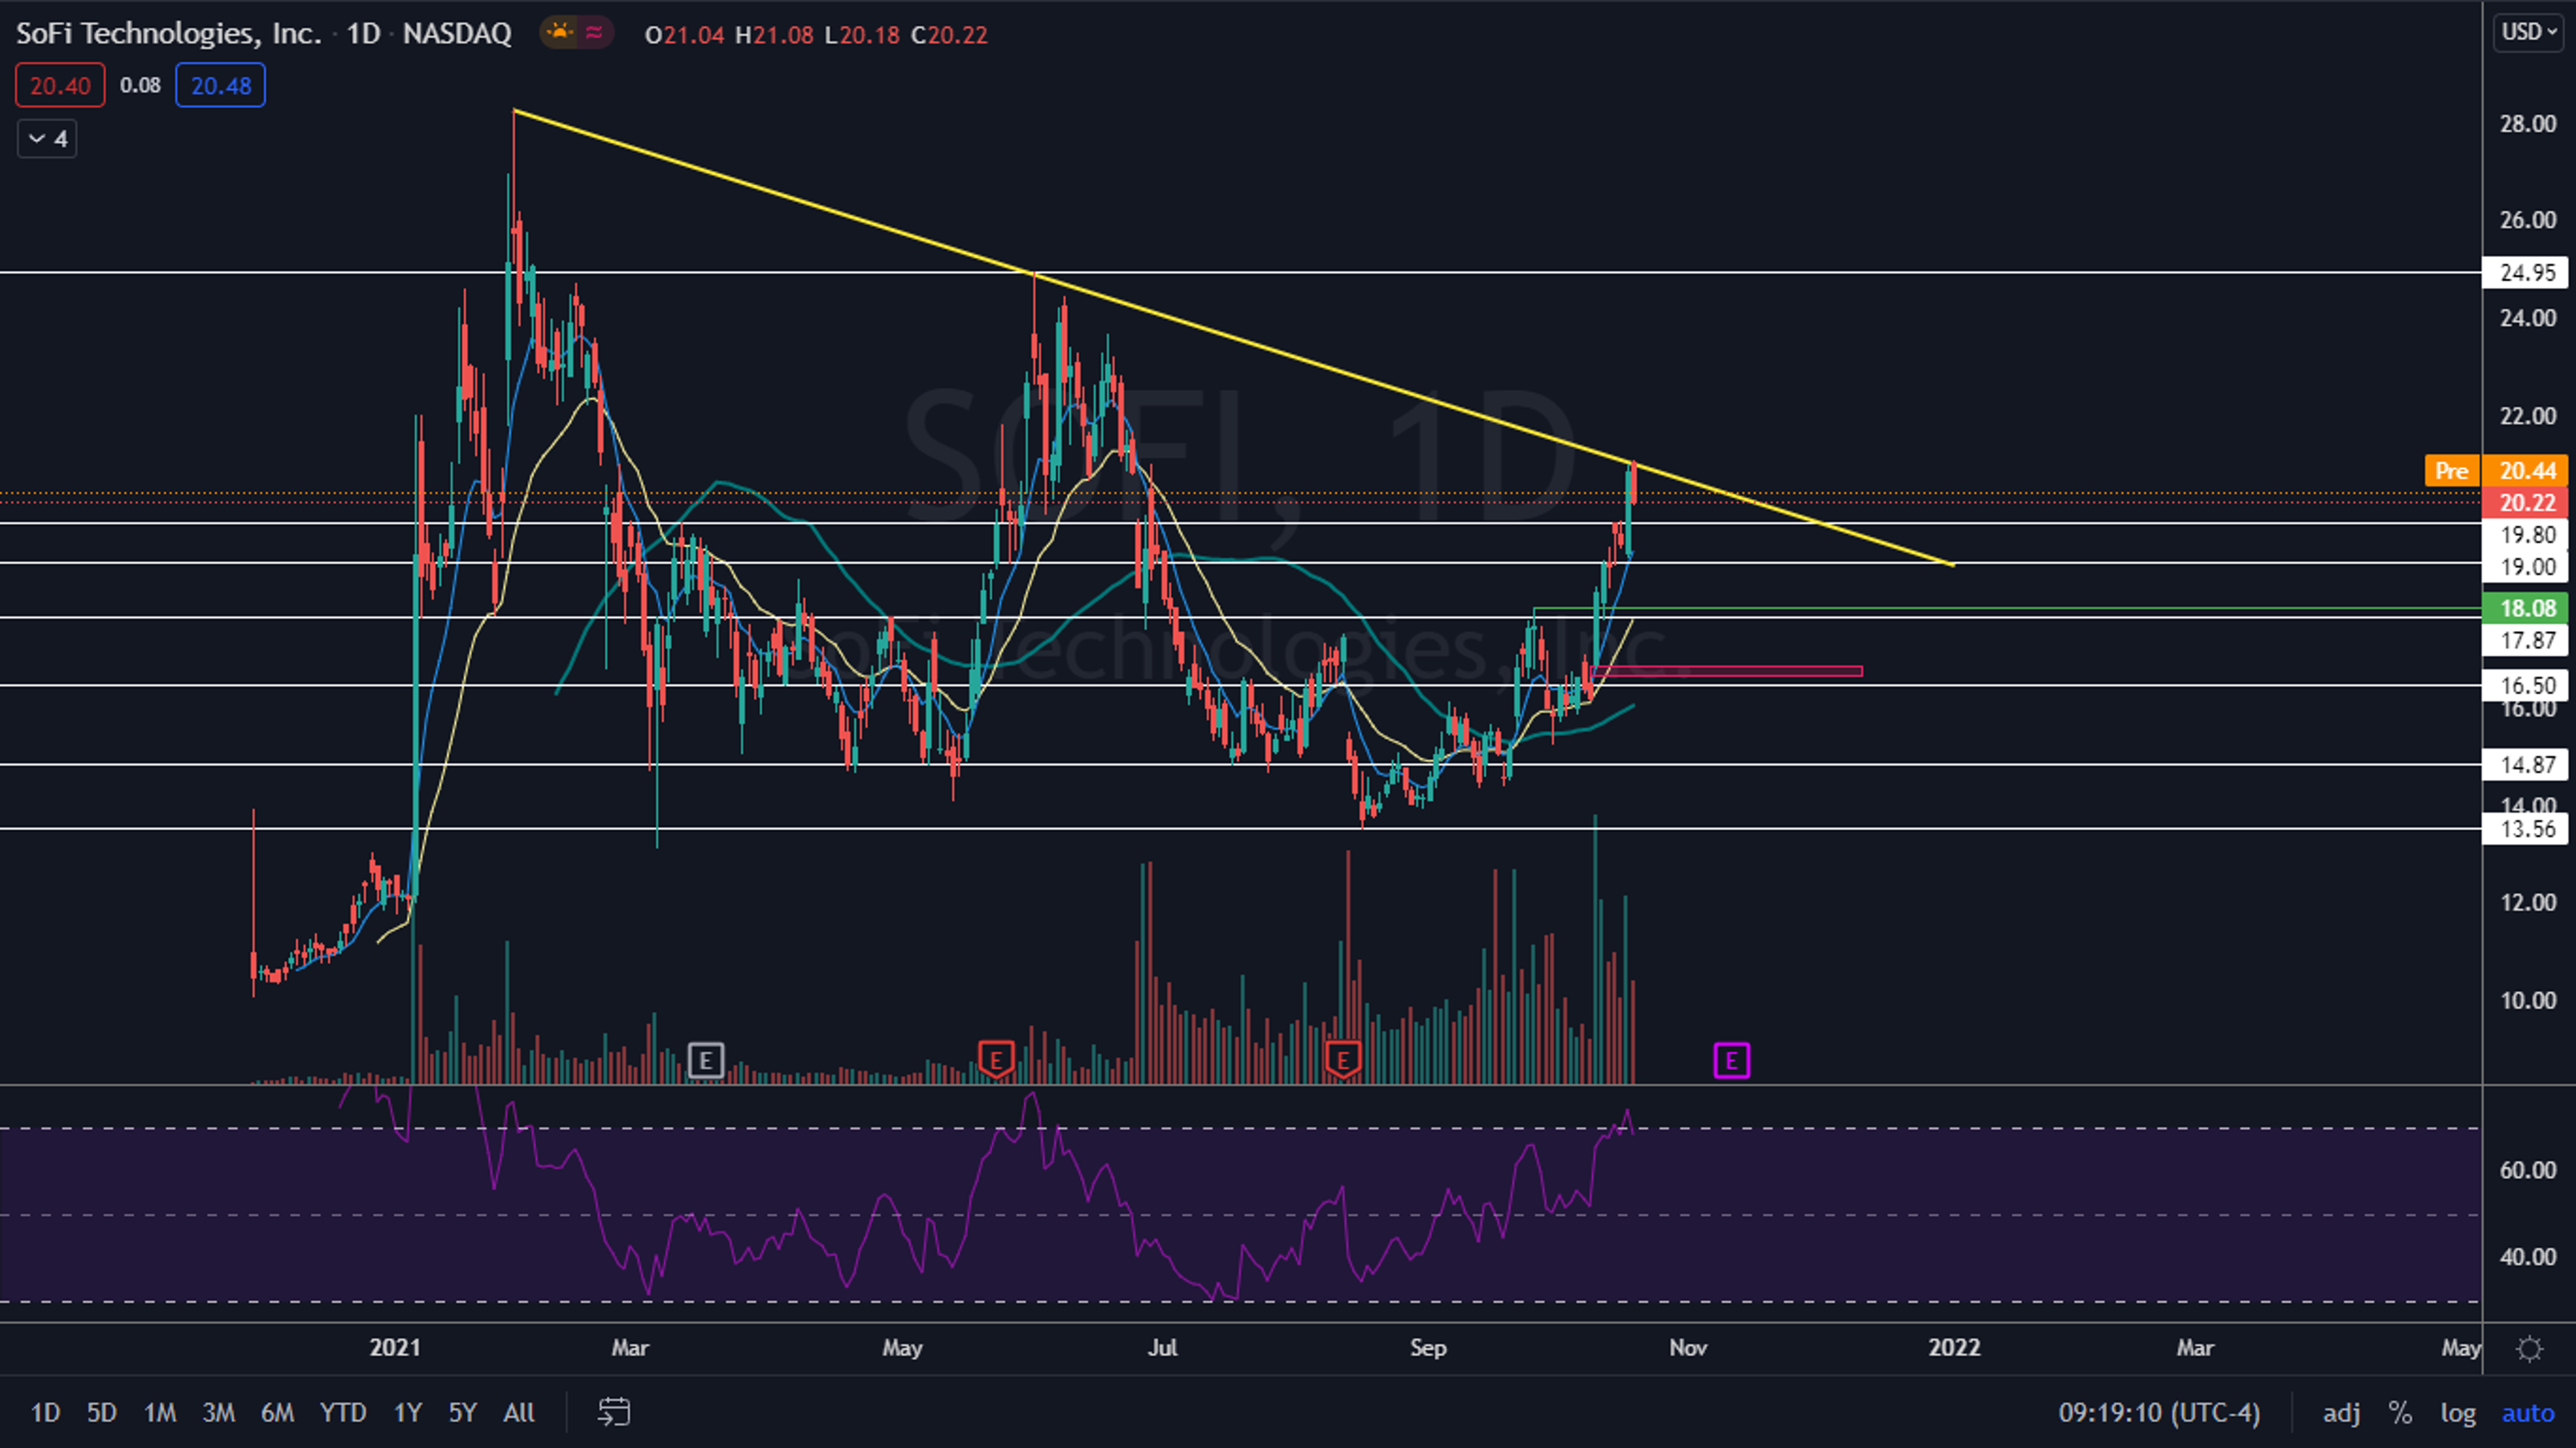
Photo courtesy of Nike.
© 2025 Benzinga.com. Benzinga does not provide investment advice. All rights reserved.