


Travel through U.S. airports continues to increase as COVID-19 vaccinations ramp up and customers return to the skies. On Friday, the Transportation Security Administration reported 2,081,115 travelers passed through airport security checkpoints, up 310% over the same date in 2020.
After periods of consolidation both American Airlines Group Inc AAL and Delta Airlines, Inc. DAL also look set for take-off.
The American Airlines Chart: After creating a double top pattern at about $26 on March 18 and June 2 on the daily chart, American Airlines’ stock has consolidated in a downtrend and lost about 16% of its value. On Thursday and Friday, the stock then created a double bottom reversal pattern, at about $22.80, and bounced.
In its downtrend, between June 3 and Friday, American Airlines created a bullish falling channel pattern and on Friday it bounced up and wicked from the medium line of the pattern. Bulls will be watching for a continuation move up on Monday to break up bullishly from the channel.
American Airlines is trading below the eight-day and 21-day exponential moving averages (EMAs) with the eight-day EMA trending below the 21-day EMA, both of which are bearish indicators in the short term. The stock is trading above the 200-day simple moving average (SMA) which indicates overall sentiment in the stock remains bullish.
There are two gaps in American Airlines’ chart, one about 38% below in the $13 range and one about 20% above in the $26 range. Because gaps fill 90% of the time, it is likely American Airlines will eventually fill both gaps, however, the upper gap is closer and along with news more people are returning to travel, it is more likely the stock will fill its upper gap first.

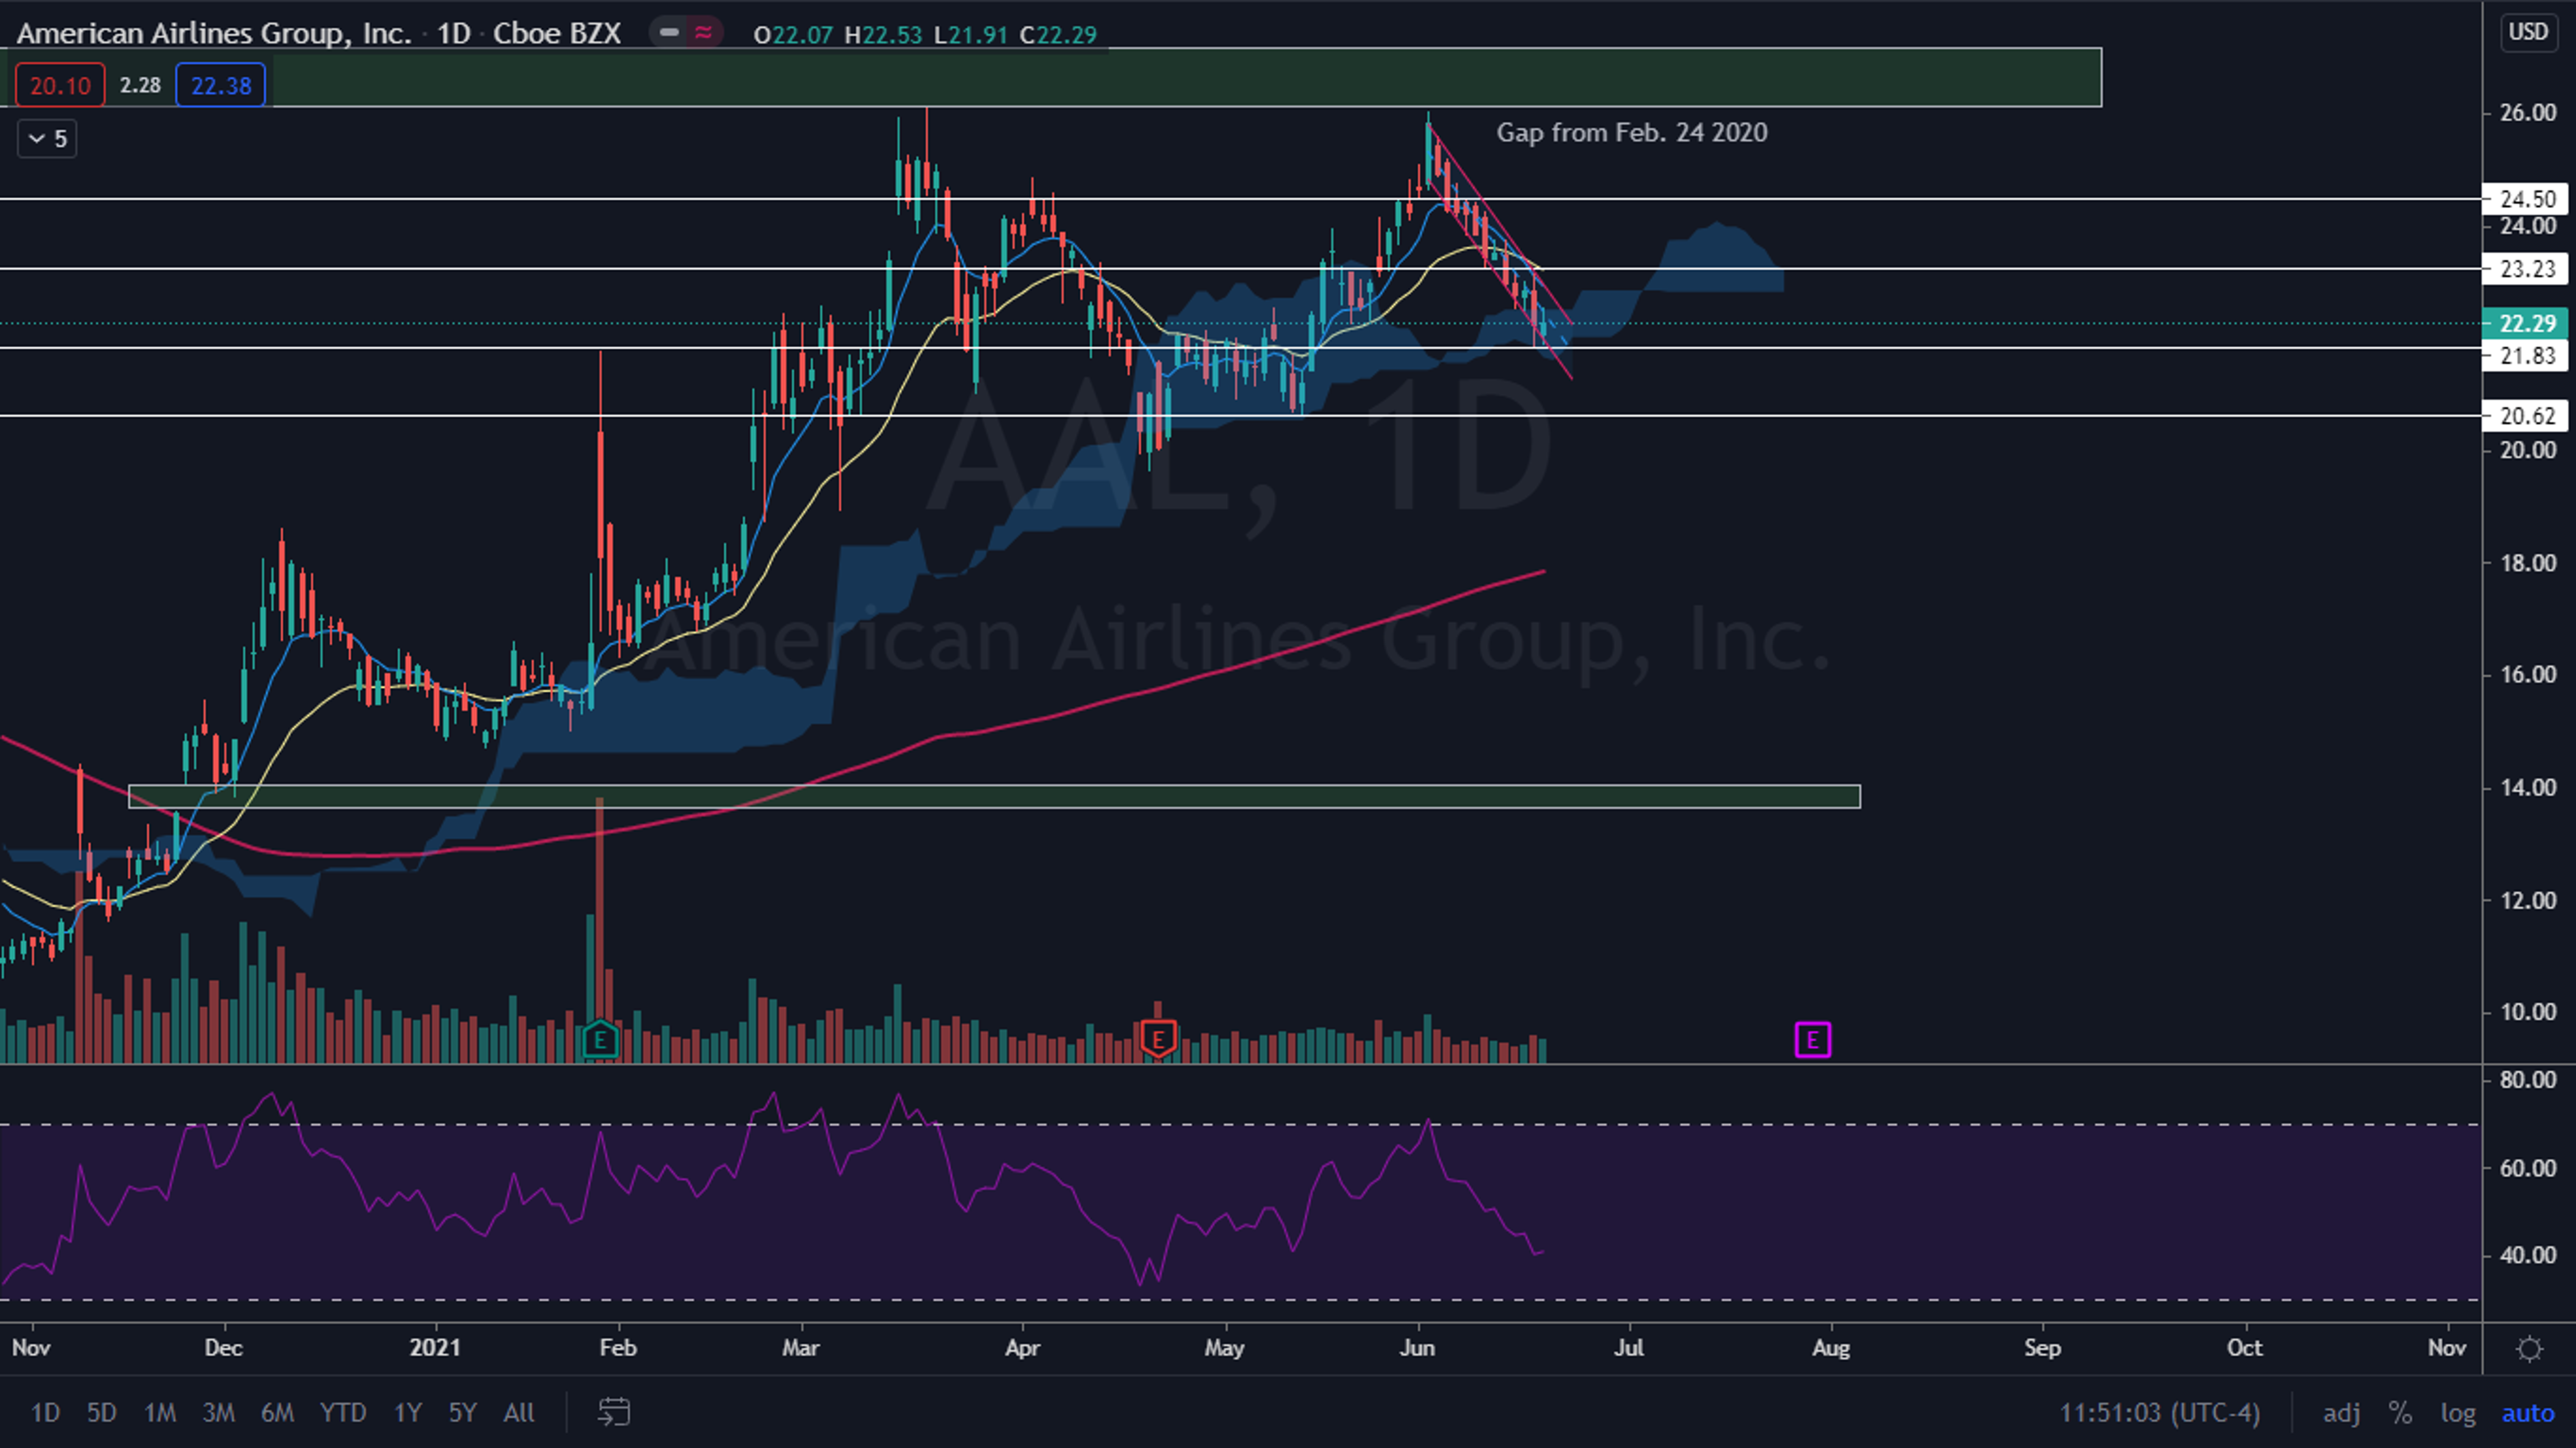
Bears want to see American Airlines continue to reject the upper trendline of the channel and for the stock to continue to trade down until it loses support at $21.83. If it was unable to hold the level as support it could revisit $20.62 before a potential bounce.
The Delta Airlines Chart: Delta’s stock completed a bearish head-and-shoulders pattern and fell down to a support level at $43.67 and bounced. Like American Airlines’ stock, Delta fell into a bullish falling channel pattern and on Friday rejected the upper sloping trendline of the pattern.
Delta also has two gaps on its chart, one about 25% below in the $32 and $33 ranges and one about 25% above in the $55 and $56 range. Like American Airlines’ it is likely Delta will fill both gaps at some point in the future.
Delta is trading slightly below both the eight-day and 21-day EMAs, which is bearish but above the 200-day SMA, which is bullish. The eight-day EMA is also trending slightly below the 21-day EMA.
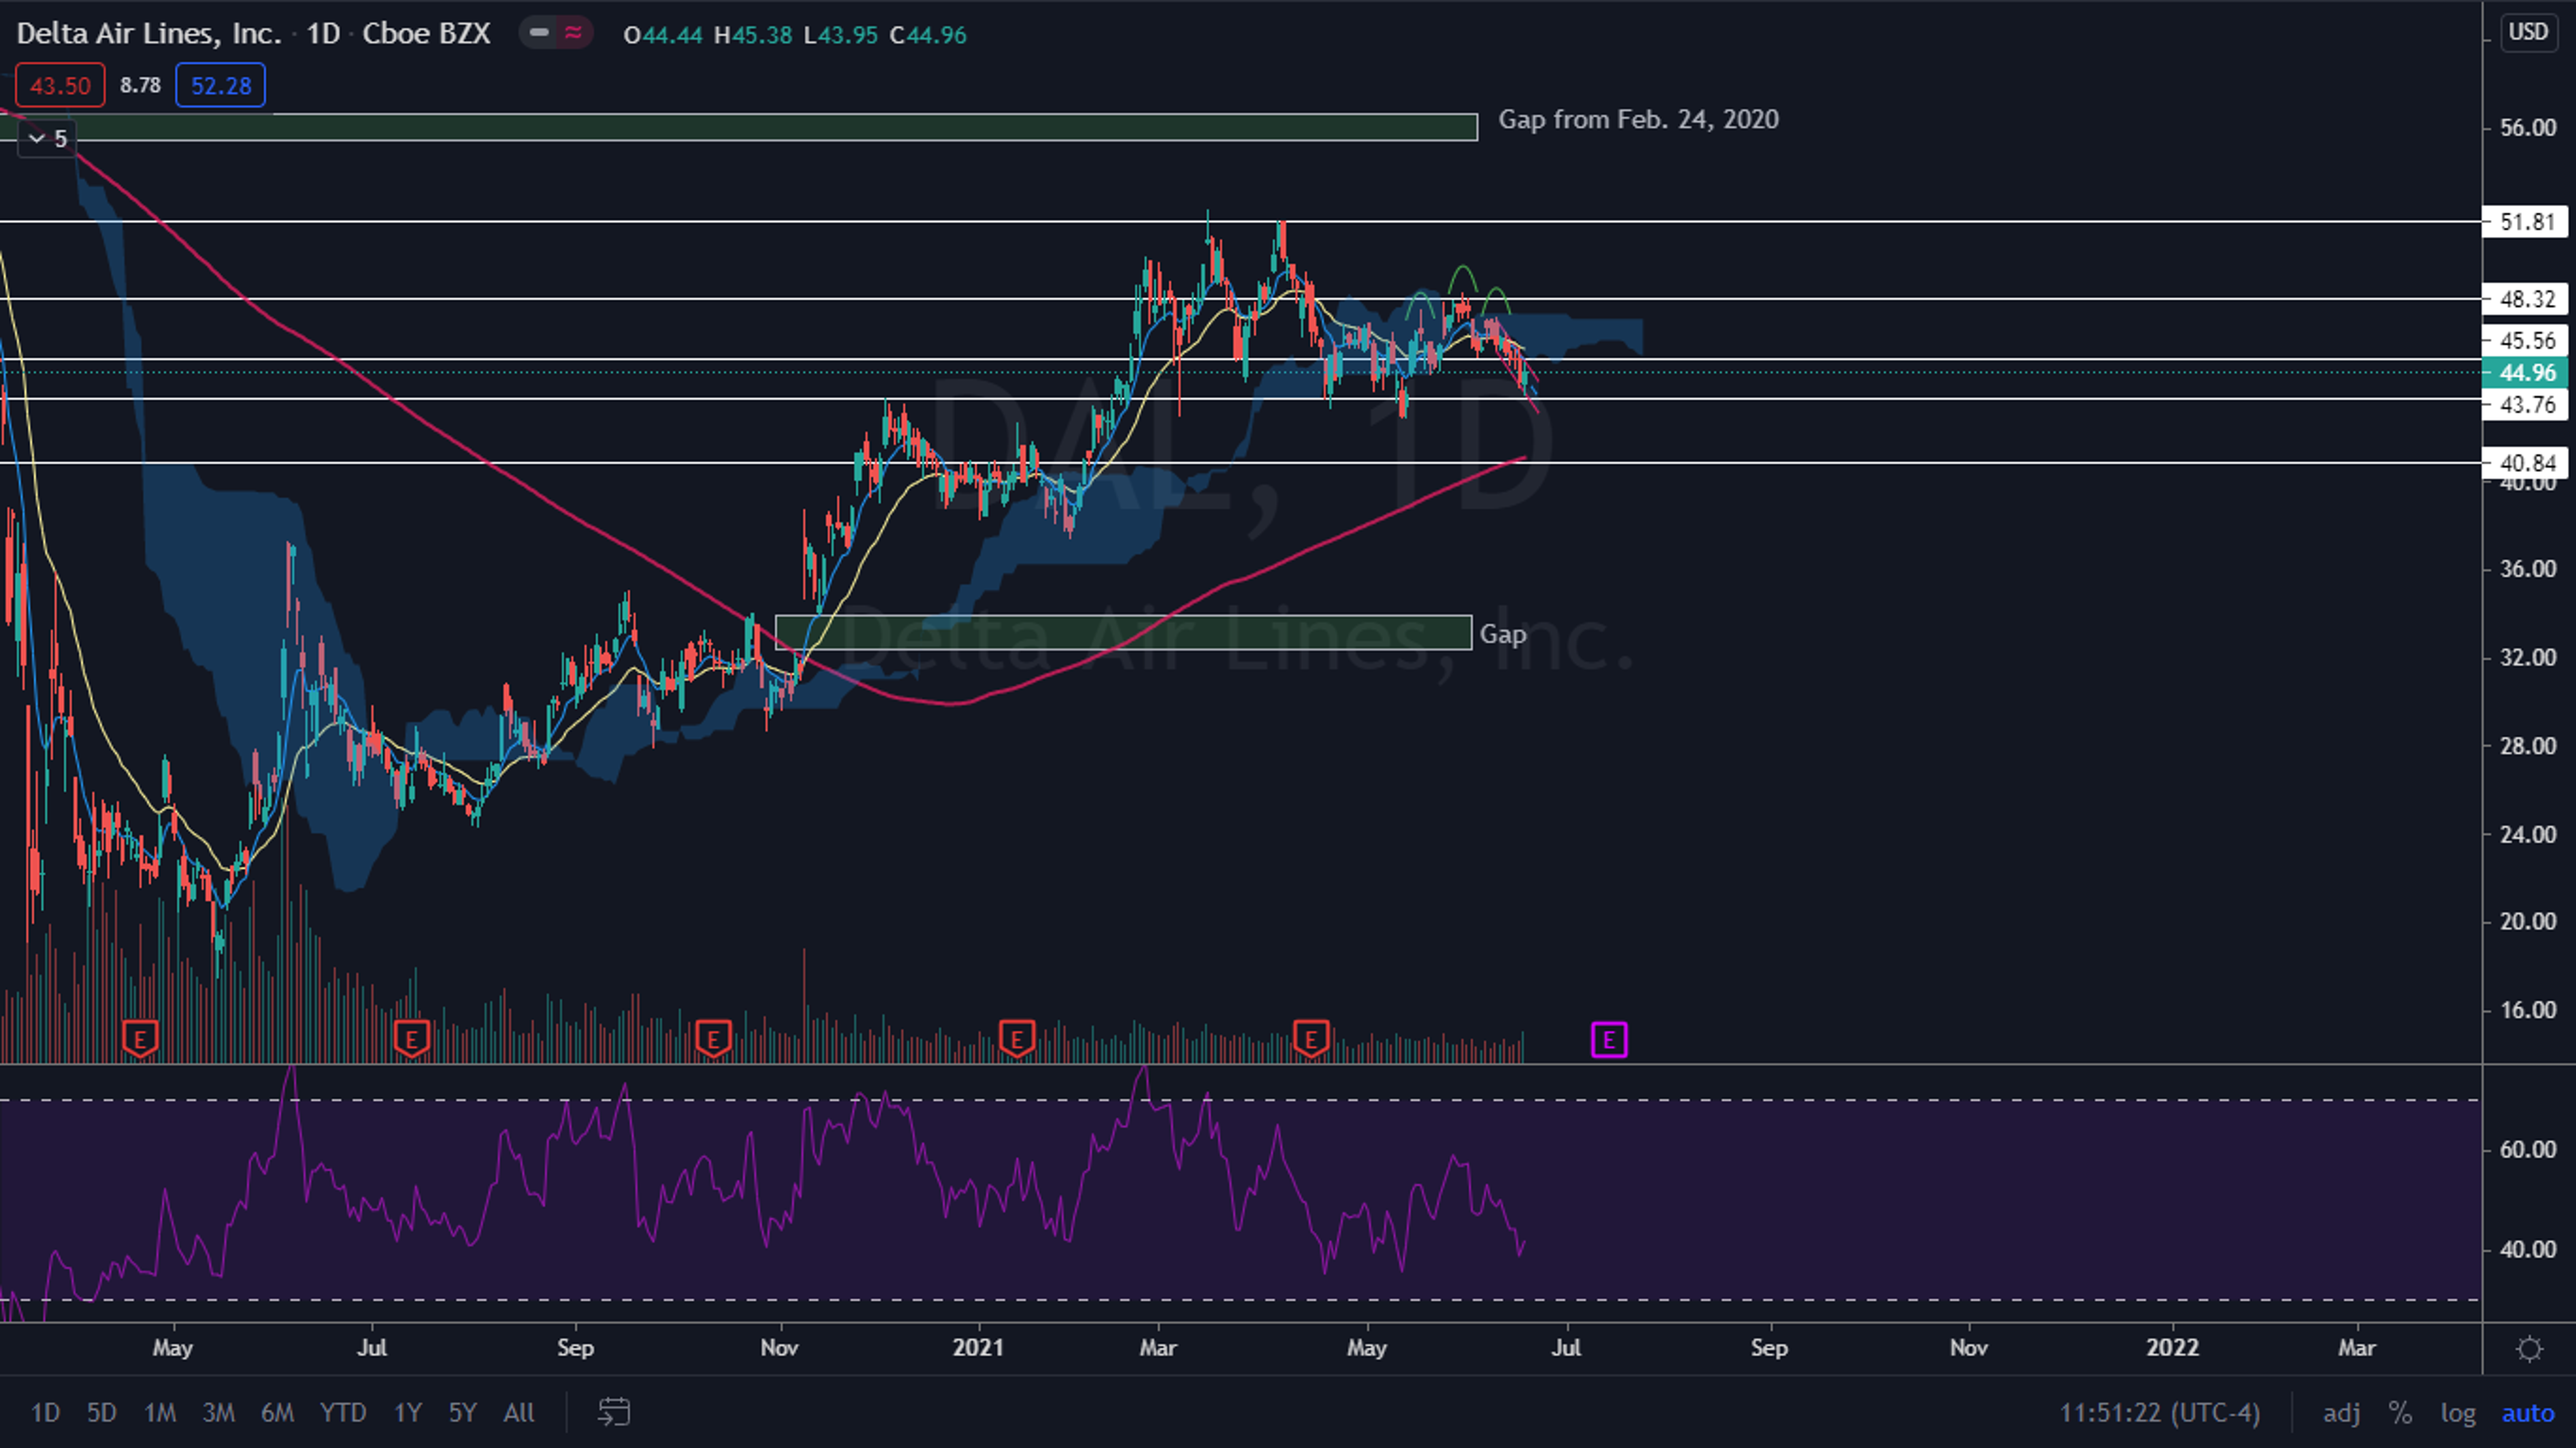
Bears want to see Delta continue to trade down in the falling channel until it loses support at $43.76. If it was unable to maintain the level as support it could fall toward the $40 level.
AAL and DAL Price Action: On Friday, American Airlines closed up 0.27% at $22.29 and shares of Delta Airlines closed up 0.88% at $44.96.
(Photo: Delta Airlines)
Edge Rankings
Price Trend
© 2025 Benzinga.com. Benzinga does not provide investment advice. All rights reserved.
Trade confidently with insights and alerts from analyst ratings, free reports and breaking news that affects the stocks you care about.

