
On June 1, Las Vegas lifted most of its COVID-19 restrictions and its hotels and casinos have been welcoming back guests to dine, shop and gamble with few restrictions.
Wynn Resorts, Ltd. (NASDAQ:WYNN) which operates six properties in the U.S. and Macau -- most notably its flagship Wynn Las Vegas and Encore Las Vegas— was the first resort to update its policies and allow fully vaccinated guests to not wear masks at its Las Vegas hotels and casinos.
Las Vegas Sands Corp. (NYSE:LVS) followed and eased restrictions, including allowing fully vaccinated guests to not wear masks, at its Venetian and Palazzo at the Venetian resorts in Las Vegas.
As the vaccination effort continues to ramp up crowds of fully vaccinated travelers will continue to feel more at ease gathering at resorts and casinos and Wynn and Las Vegas Sands’ stocks look set to benefit.
The Wynn Chart: On May 24, Wynn broke up from a descending trendline (pink) that had been holding it down since March 16. After rising 7% between May 24 and June 2, the stock fell back down and retested the trendline as support and held above it. Wynn’s stock has also continued to close above the ascending trendline (yellow) that has held as support since Jan. 28.
On Friday, Wynn’s stock printed a bullish green hammer candlestick, which indicates higher prices may come over the next few trading days. The long lower wick on the candle demonstrates that when the price dipped during Friday’s session buyers came in.
Wynn is trading less than 1% below the eight-day and 21-day exponential moving averages (EMAs), which is slightly bearish, but bullish volume on Monday would help Wynn’s stock to regain both EMAs as support fairly easily. The stock is trading well above the 200-day simple moving average (SMA), which indicates overall sentiment in Wynn is bullish.

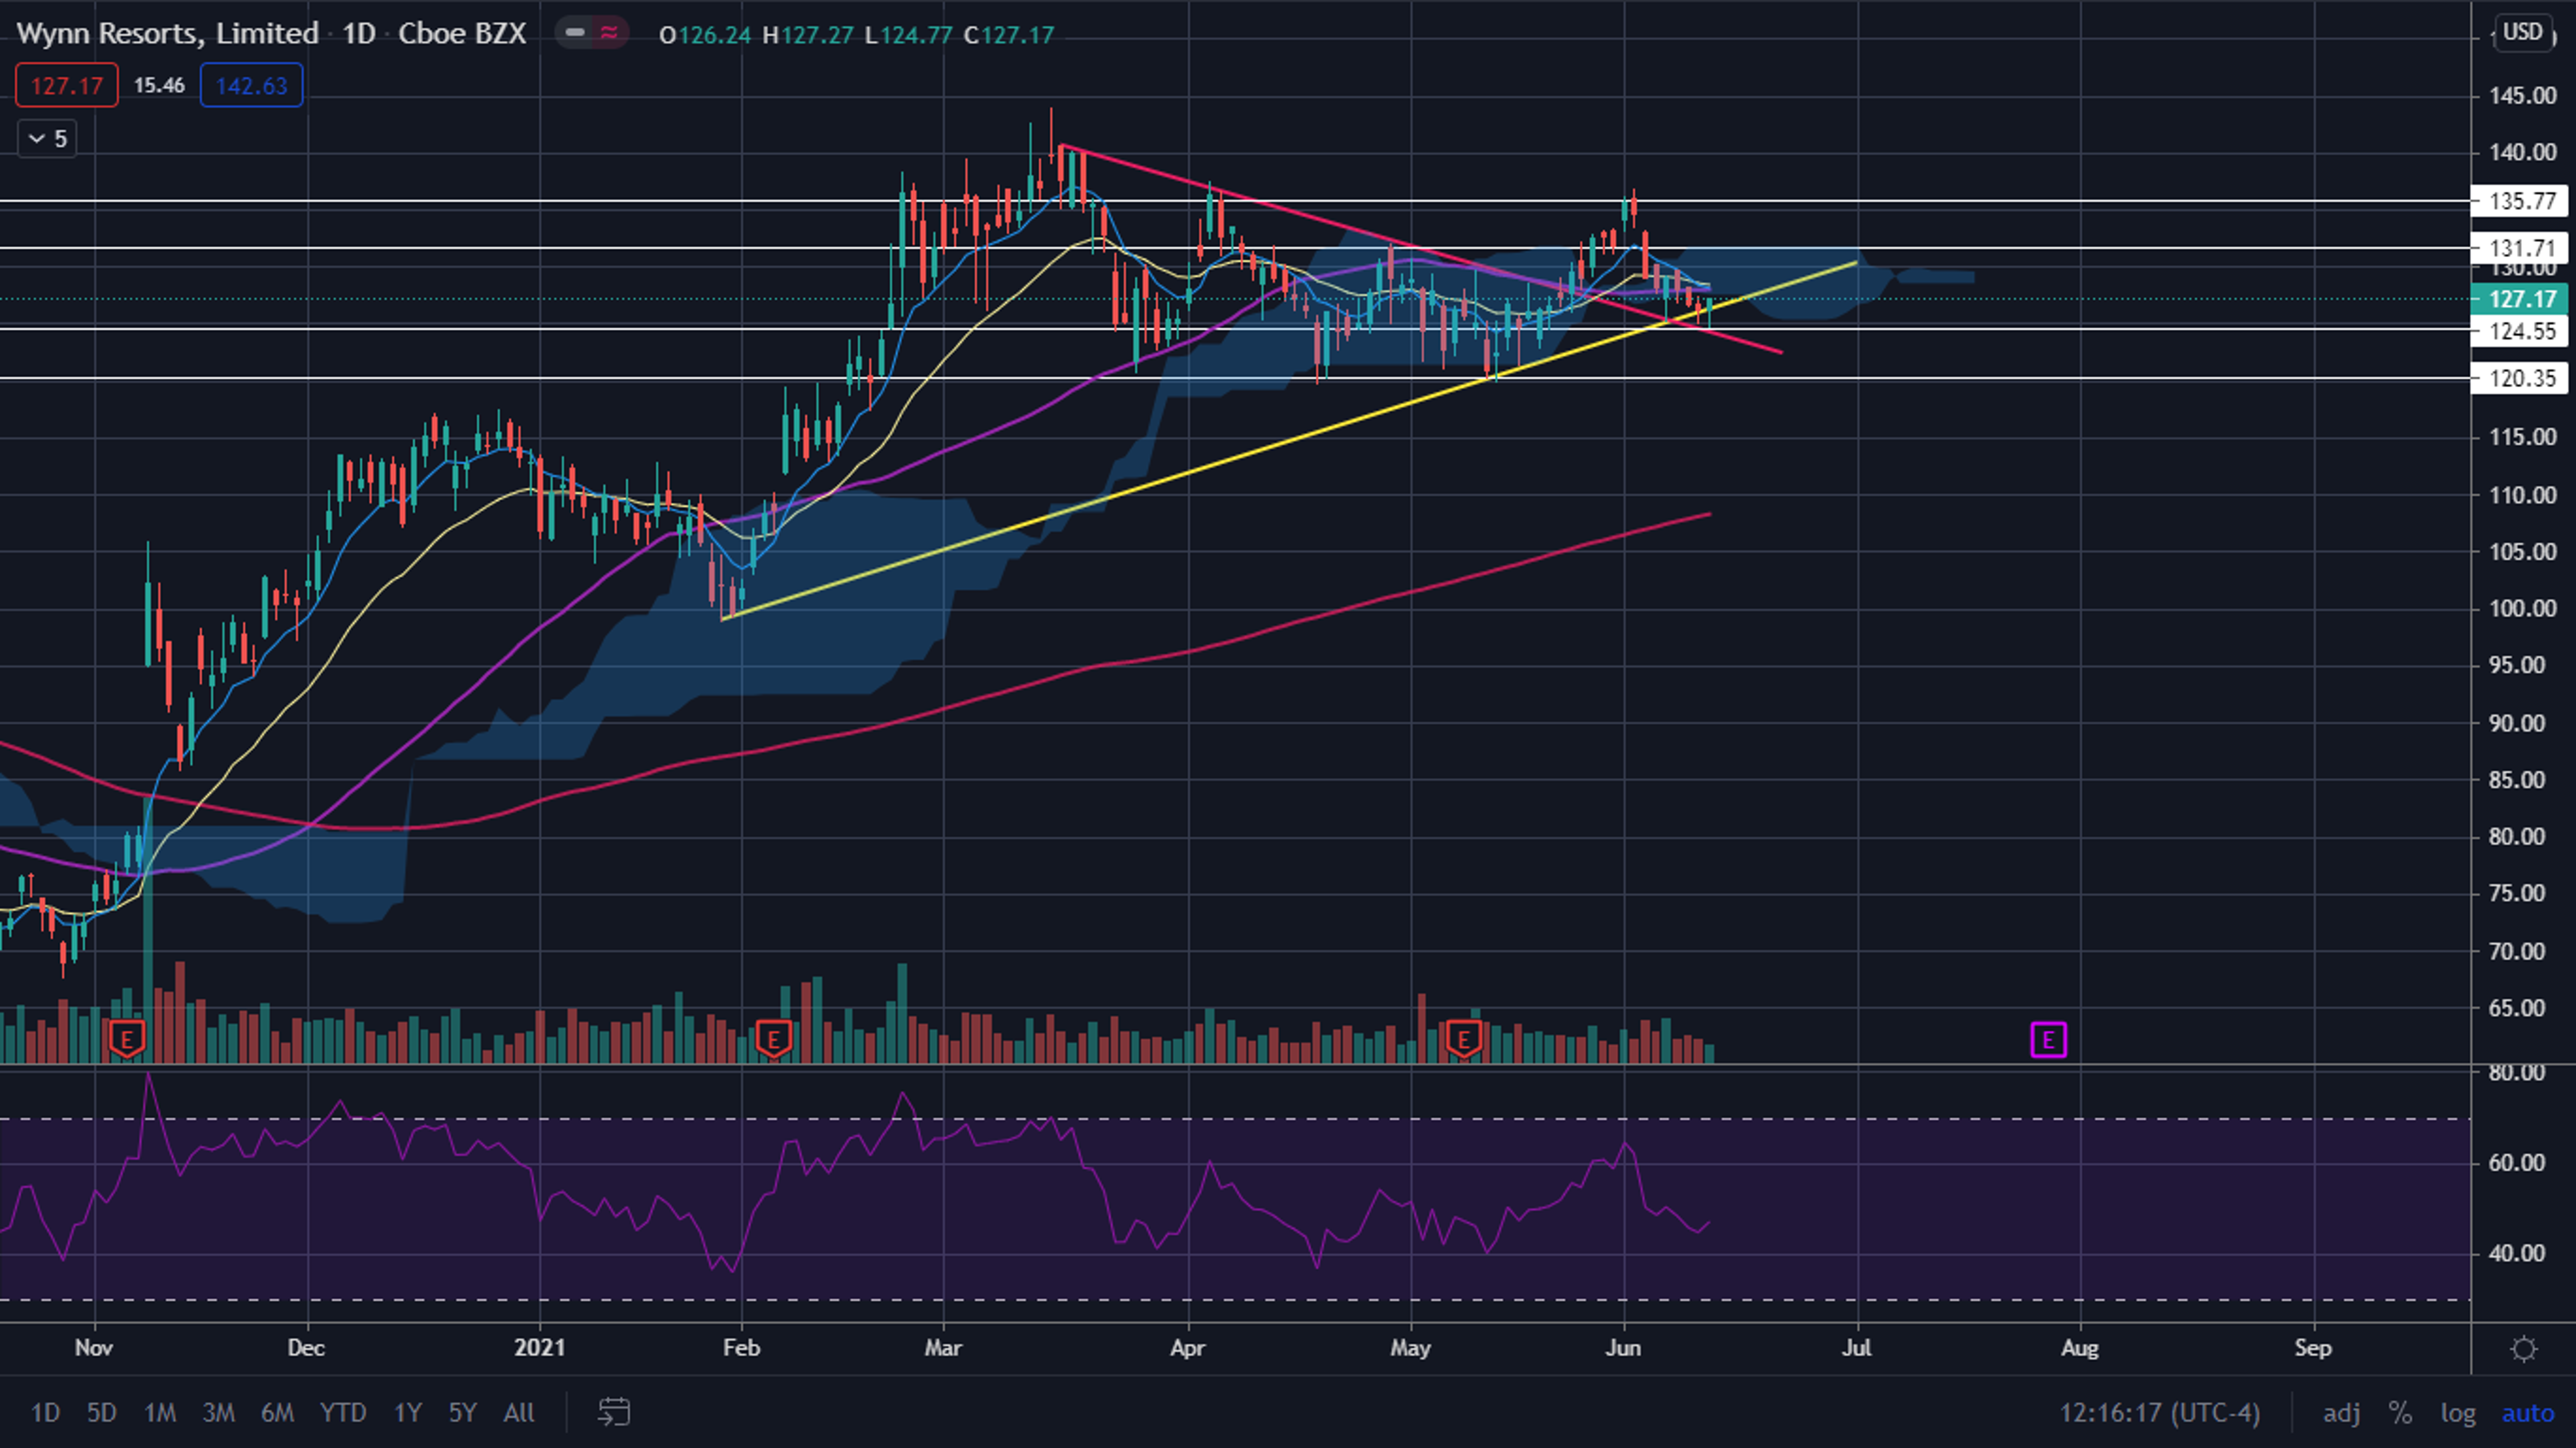
Bulls want to see bullish volume come in and pop Wynn’s stock up over the eight-day and 21-day EMAs to help push it up toward the $131 area. If the stock can regain those three levels as support, it has room to move up to $135.77.
Bears want to see the eight-day and 21-day EMAs continue to act as resistance and for the EMAs to push Wynn’s stock down under support at $124.55. If Wynn lost that area of support, it could fall toward $120.
The Las Vegas Sands Chart: Las Vegas Sands has been trading in a downtrend since March 16, putting in fairly consistent lower highs and lower lows. In the downtrend, however, it has formed a bullish descending channel pattern. Las Vegas Sands, like Wynn, printed a bullish green hammer candlestick on Friday, indicating higher prices may be in the cards.
Although Las Vegas Sands doesn't look as bullish as Wynn in terms of the eight-day and 21-day EMAs and the 200-day SMA, the stock is trading within reach of each indicator. Bullish volume would allow Las Vegas Sands to easily recapture support of the 200-day SMA and the eight-day EMA, which would change both the long term and short-term sentiment bullish.
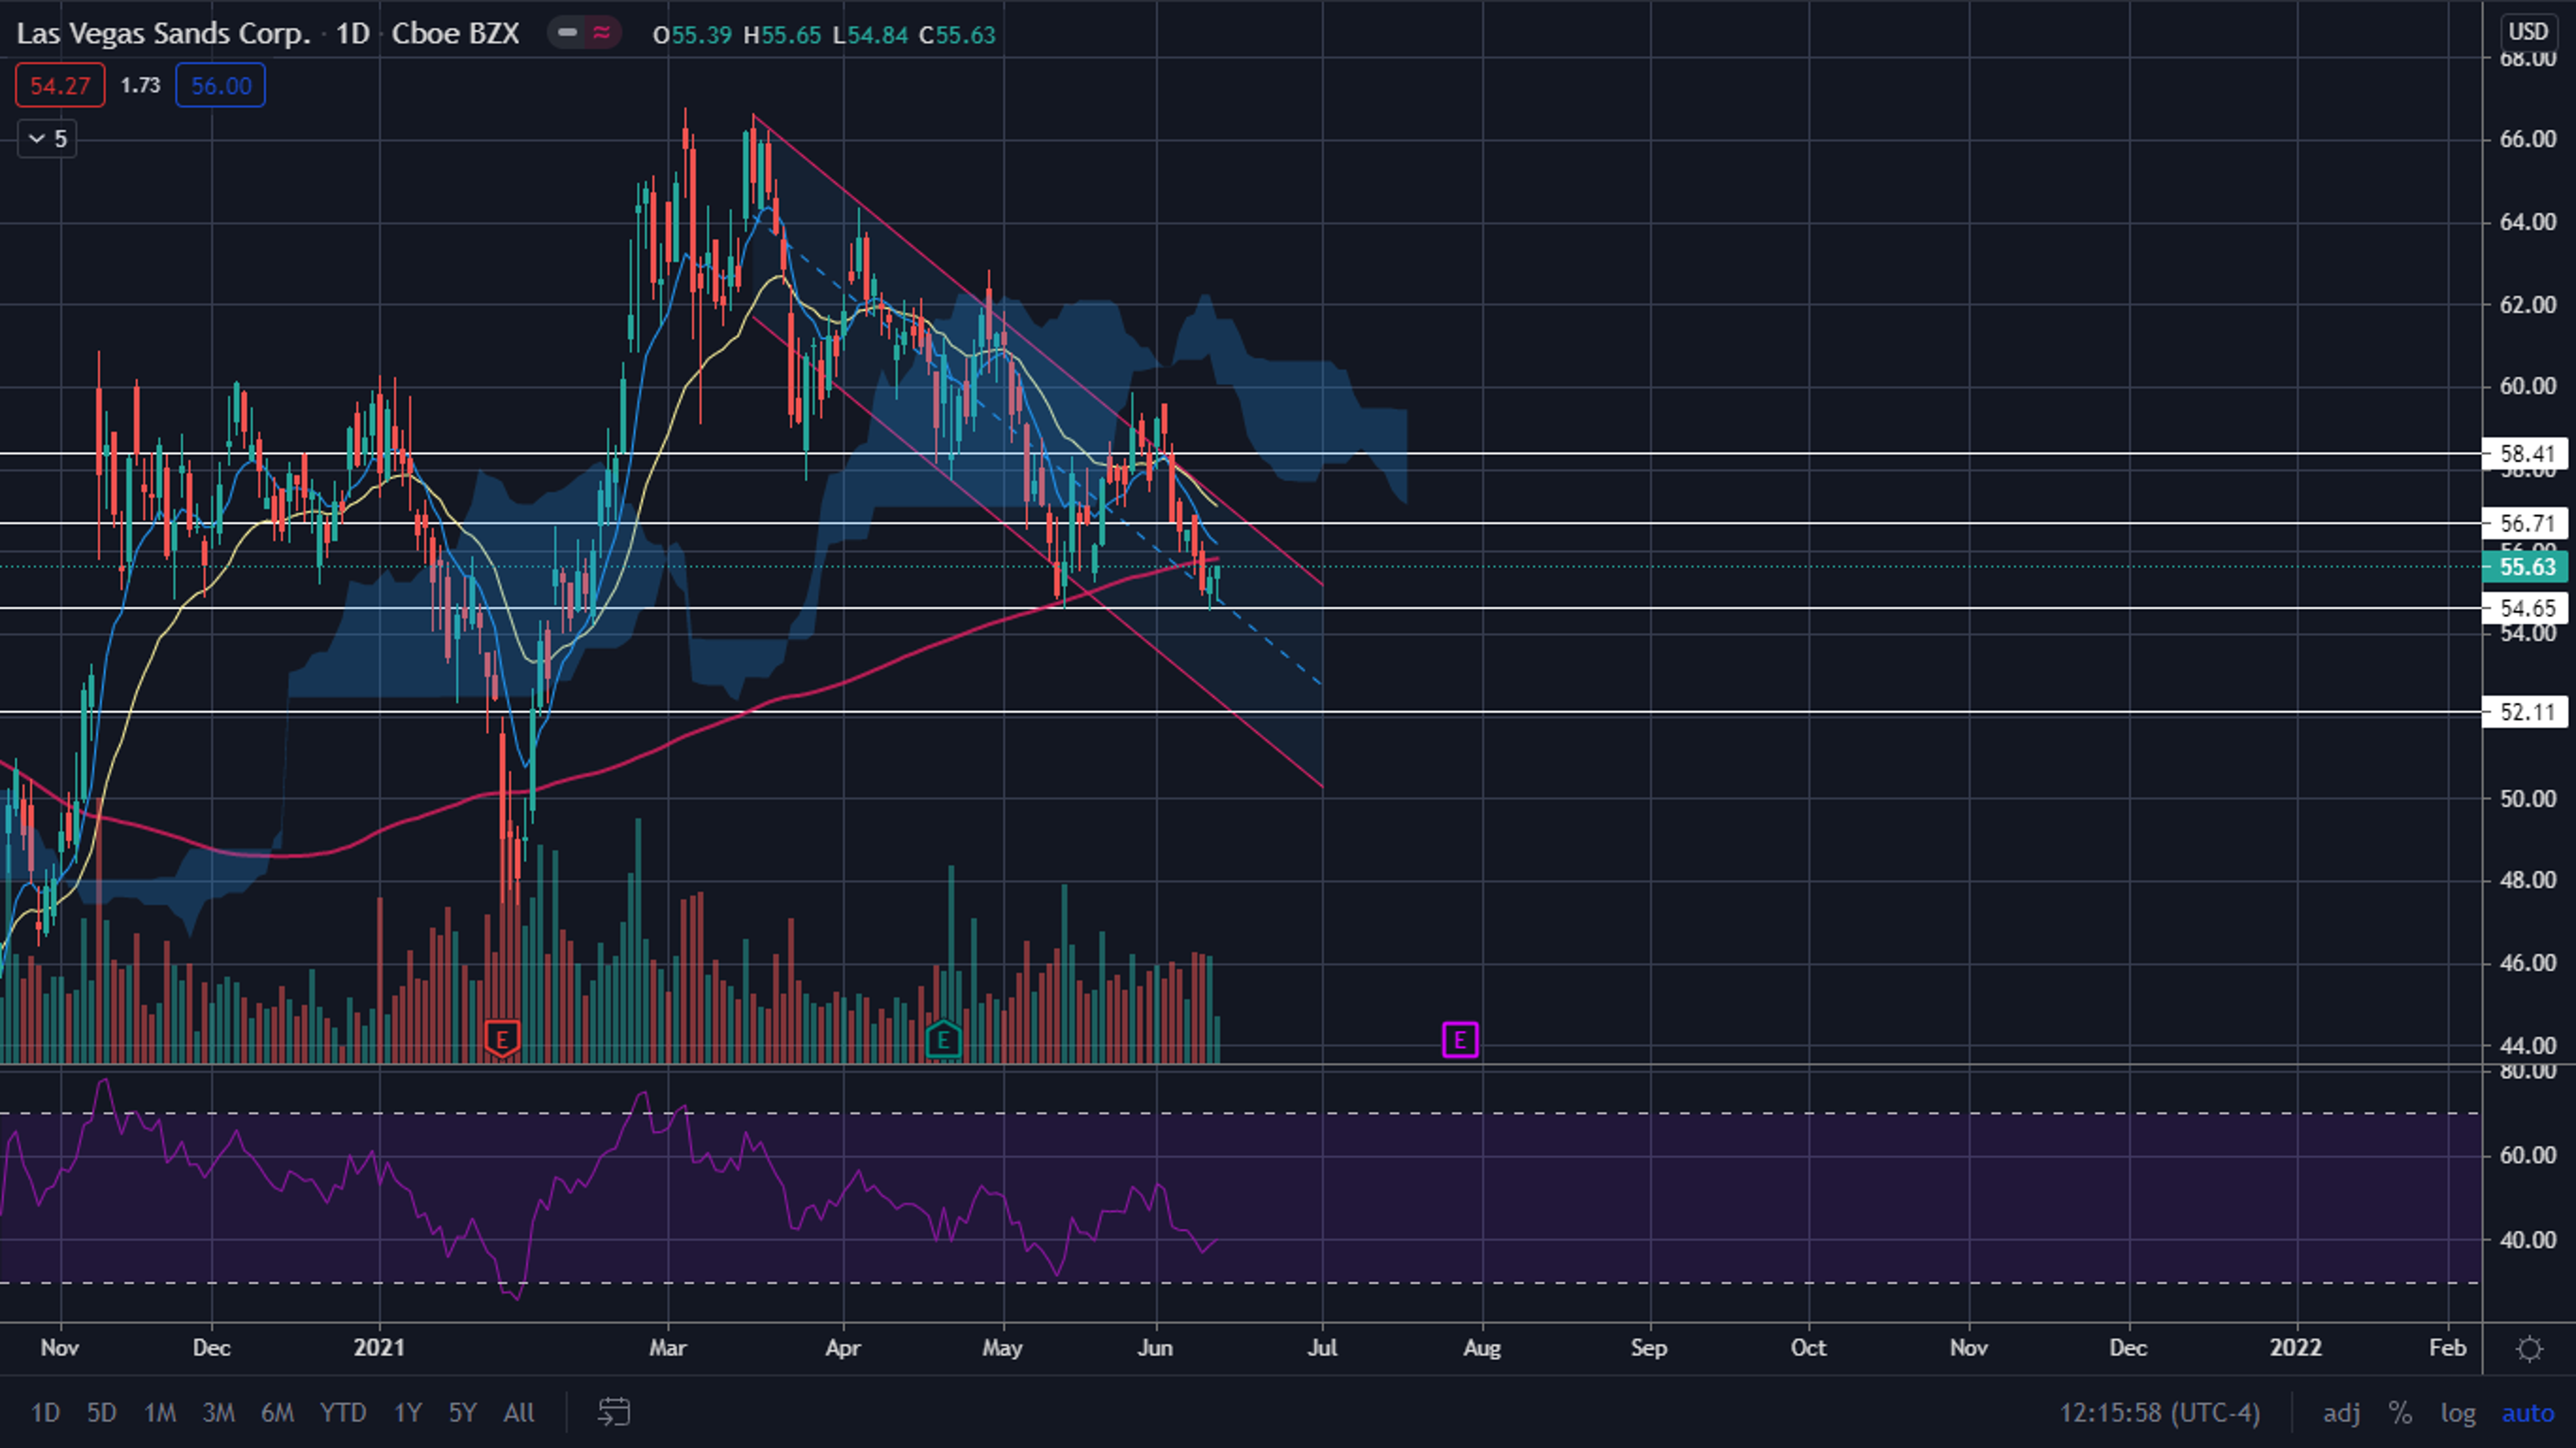
Bulls want to see bullish volume increase and for the stock to regain the 200-day SMA as support to push the stock up toward $56.71. If Las Vegas Sands’ stock was able to regain that level as support, and break up through the descending channel, it has room to move up toward $58.41.
Bears want to see the 200-day SMA act as resistance and push Las Vegas Sands’ stock down under support at $54.65. If the stock loses that level it could fall to $52.11
WYNN and LVS Price Action: Shares of Wynn closed up 0.79% Friday at $127.17 while Las Vegas Sands closed up 0.43% at $55.63.
© 2025 Benzinga.com. Benzinga does not provide investment advice. All rights reserved.