


On Tuesday, BlackBerry Ltd BB and International Business Machines Corporation IBM announced a new partnership where IBM has agreed to sell BlackBerry’s BlackBerry Spark platform to governments and enterprises nationwide.
Both stocks have recently retraced from new highs. While IBM is trading down 4.6% from its March 29 high of $137.07, BlackBerry’s stock has plummeted a whopping 68% from its Jan. 27 high of $28.80.
BlackBerry’s fall, unlike the retracement of IBM’s stock, is inorganic, however, as BlackBerry’s parabolic move, in both directions, was due to the stock being a target of the r/WallStreetBets community.
There are key levels and patterns in both tech stocks for traders and investors to watch going forward.
See Also: BlackBerry Suffers Fallout Of Global Chip Shortage As It Misses On Q4 Earnings
The BlackBerry Chart: BlackBerry’s rise in January pushed the stock to a level it hadn’t traded at since September 2011. The stock plummeted over the following four trading sessions and it has since settled into a slow grinding downtrend with daily lower highs and lowers lows.
BlackBerry’s stock is trading below both the eight-day and 21-day exponential moving averages (EMAs), which is bearish, but it has been testing a descending trendline that has been holding it down since Feb. 8. If it can break above the descending trendline, the stock could see a bullish push to the upside.
Bulls want to see BlackBerry’s stock jump over the descending trendline, which would cause the eight-day EMA to cross above the 21-day EMA. BlackBerry could then see a push to its next resistant level at $10.68. If Blackberry’s stock can climb over that resistance level, then there isn’t much resistance left until the $12 mark.
Bears want to see BlackBerry’s stock continue to be pushed down by the descending trendline until it loses support at $8.36.


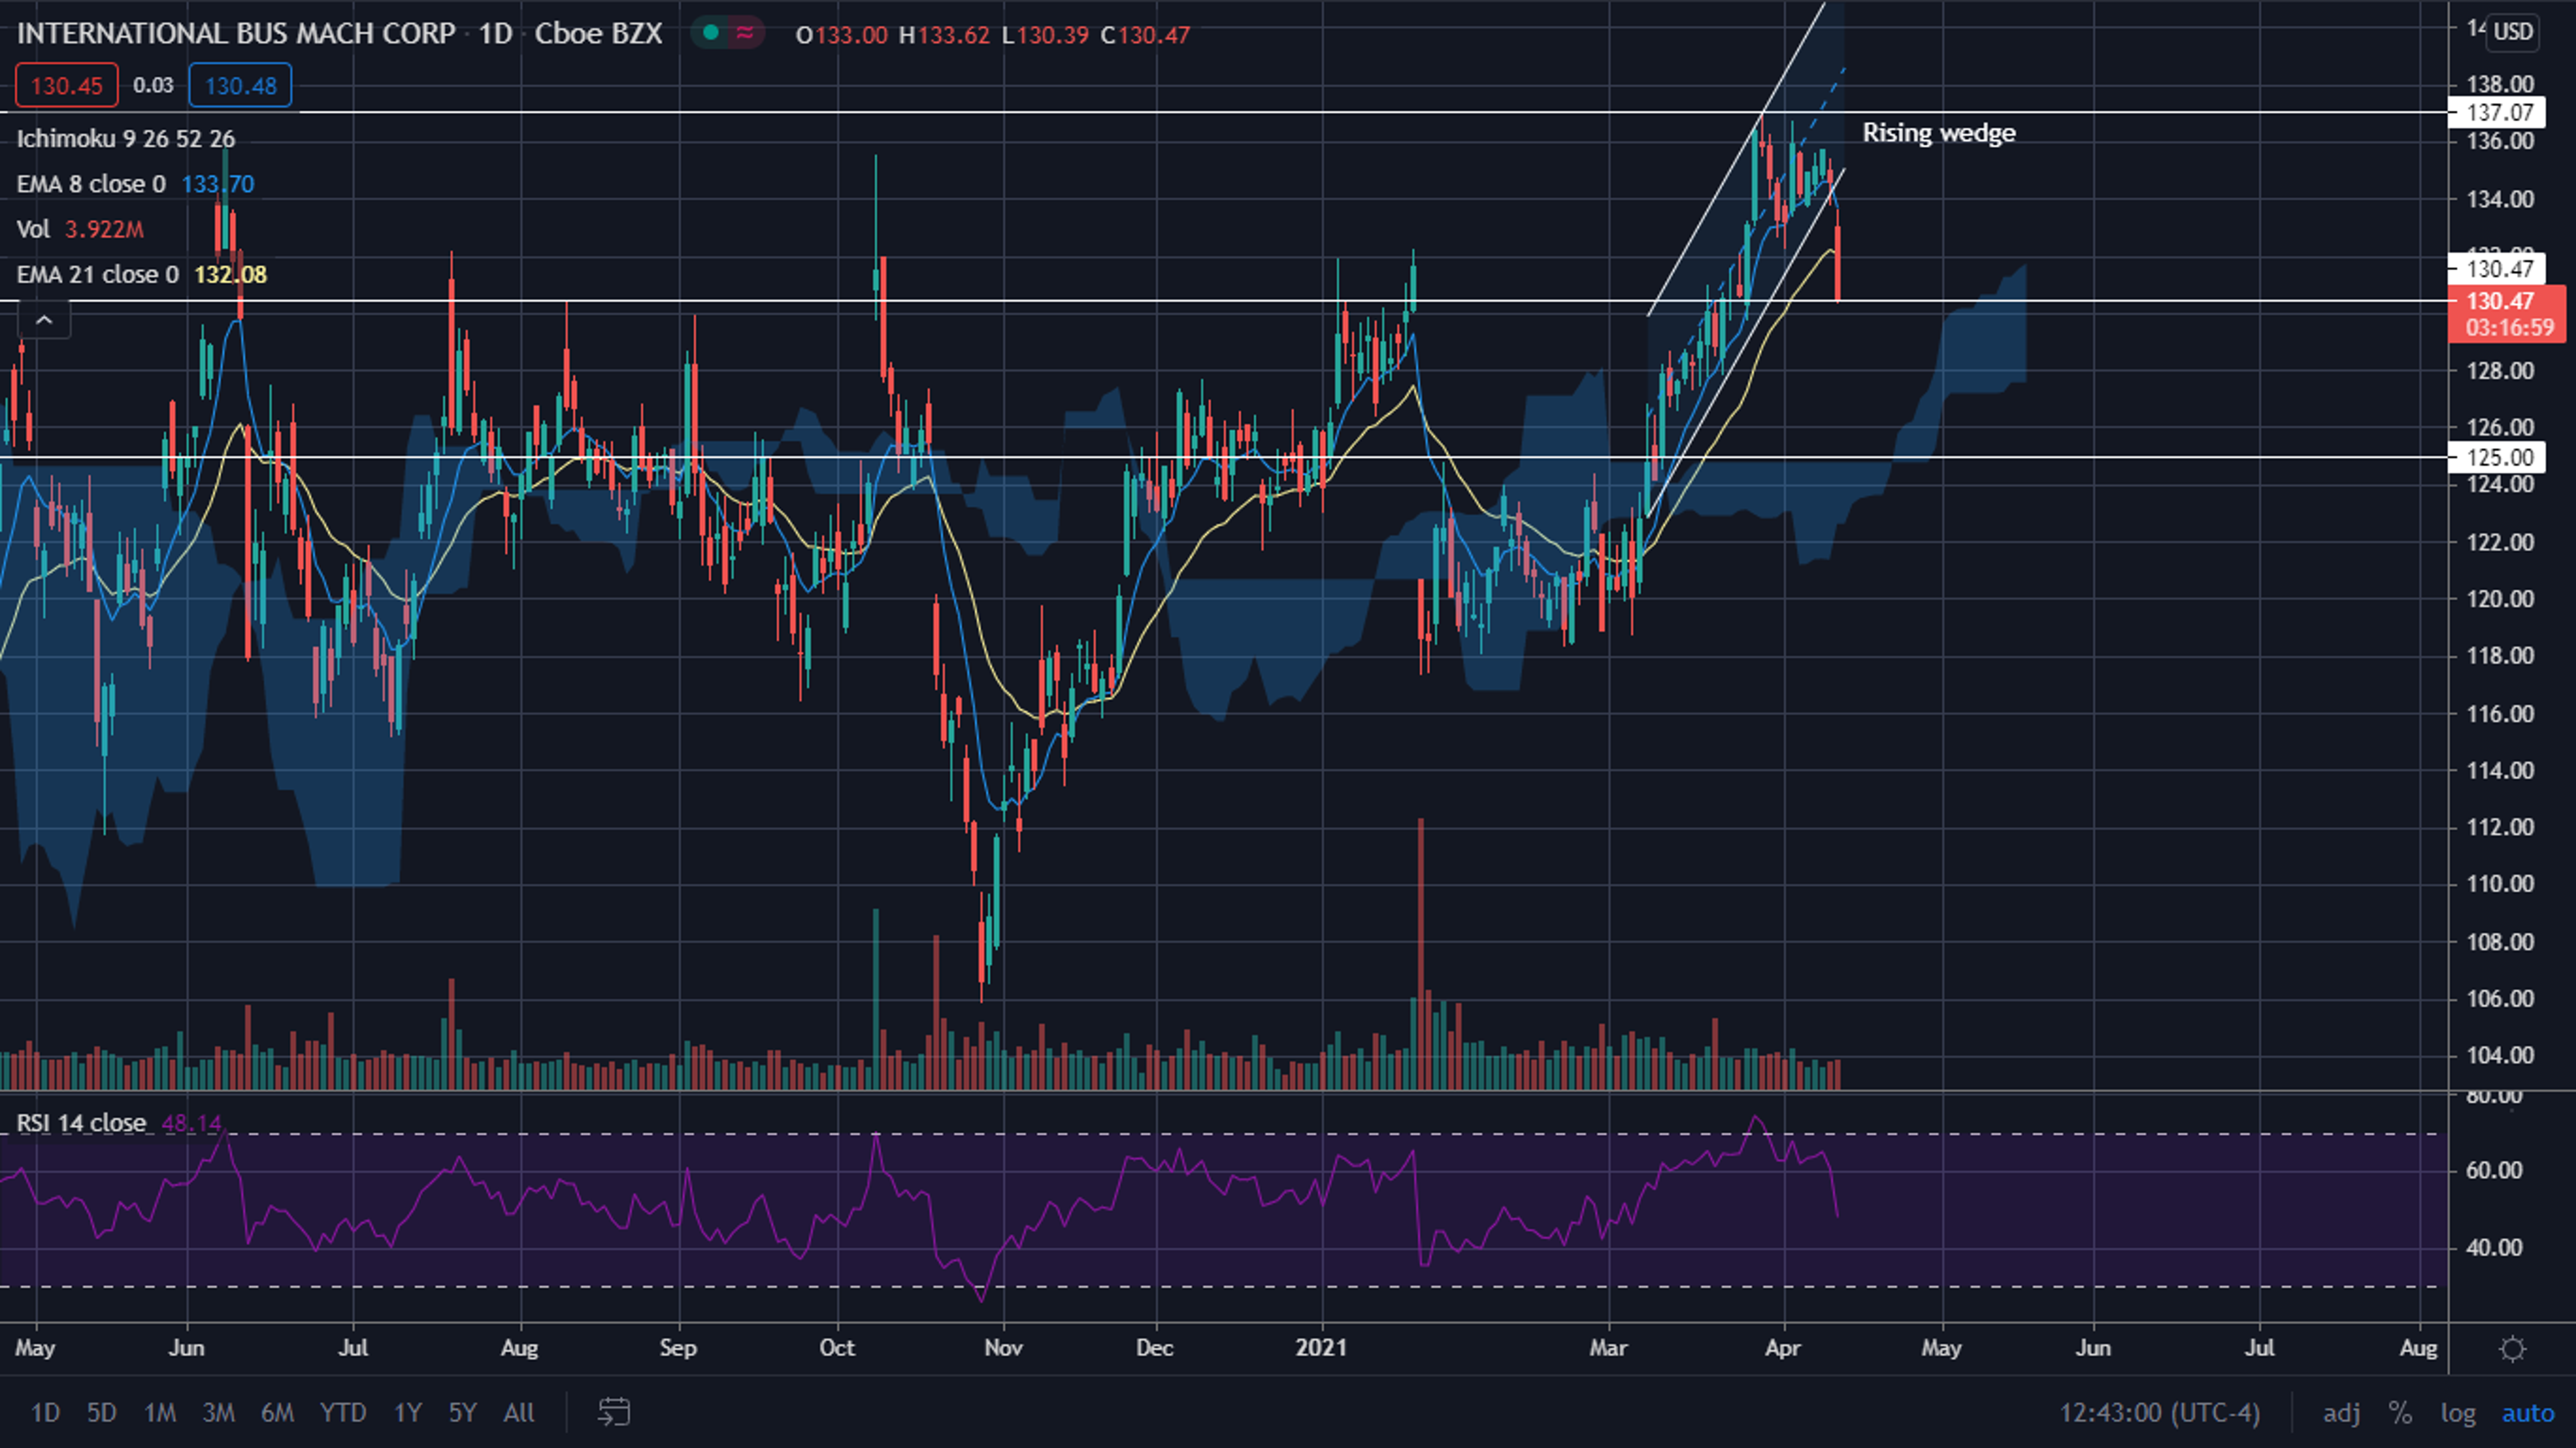
The IBM Chart: On Tuesday, IBM’s stock broke down from a bearish ascending channel it had been rising into since March 8. The breakdown from the channel caused IBM’s stock to fall under both the eight-day and 21-day EMAs which is bearish. IBM hit its next support level at $130.47.
Bulls will want to see IBM hold support near the $130 level and for bear volume to decrease over the coming days before looking to take a position.
Bears want to see the stock fall through $130, which could cause another big bearish push down towards the $125 area.
Edge Rankings
Price Trend
© 2025 Benzinga.com. Benzinga does not provide investment advice. All rights reserved.
Trade confidently with insights and alerts from analyst ratings, free reports and breaking news that affects the stocks you care about.

