
Airbnb Inc. ABNB shares are trading higher Tuesday with the compan set to report earnings after the market close.
Airbnb closed up 6.1% at $180.07 a share.
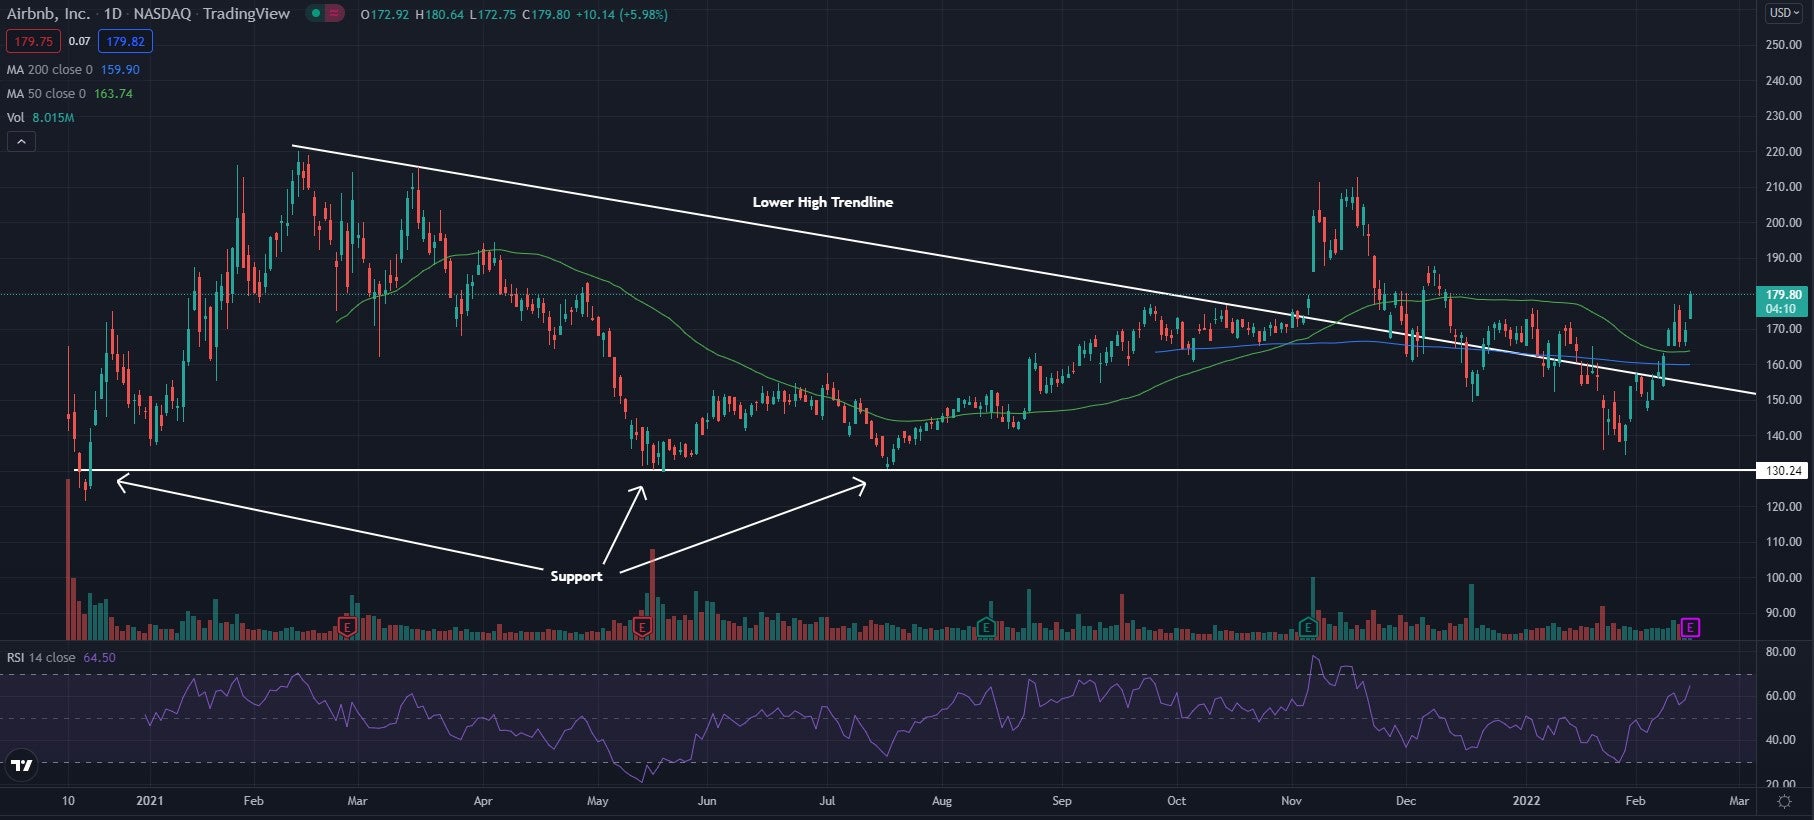
Airbnb Daily Chart Analysis
- The stock was trading in what technical traders call a descending triangle pattern. This is known as a bearish continuation pattern, but since the stock was able to cross above the resistance in the pattern, it's looking more bullish.
- The stock trades above both the 50-day moving average (green) and the 200-day moving average (blue). This indicates bullish sentiment, and each of these moving averages may hold as an area of support in the future.
- The Relative Strength Index (RSI) has been climbing for the past couple of months and now sits at 65. This shows there is now more buying pressure in the stock than there is selling pressure. This is a very bullish sign.
What’s Next For Airbnb?
The stock breaking above the lower high trendline shows the stock has bullish momentum. The break over this level has shown that the stock was unable to stay in the bearish pattern and has begun to move bullishly once again.
Bullish traders want to see the stock hold above the moving averages and see the higher lows continue to form. Bearish traders want to see the stock fall back below the lower high trendline and go on to fall below the $130 support level.
© 2024 Benzinga.com. Benzinga does not provide investment advice. All rights reserved.
Comments
Trade confidently with insights and alerts from analyst ratings, free reports and breaking news that affects the stocks you care about.

