Benzinga

España
Italia
대한민국
日本
Français
Benzinga Edge
Benzinga Research
Benzinga Pro

  • Get Benzinga Pro
  • Data & APIs
  • Events
  • Premarket
  • Advertise
Contribute
España
Italia
대한민국
日本
Français

Benzinga

  • Premium Services
  • Financial News
    Latest
    Earnings
    Guidance
    Dividends
    M&A
    Buybacks
    Interviews
    Management
    Offerings
    IPOs
    Insider Trades
    Biotech/FDA
    Politics
    Healthcare
    Small-Cap
  • Markets
    Pre-Market
    After Hours
    Movers
    ETFs
    Options
    Cryptocurrency
    Commodities
    Bonds
    Futures
    Mining
    Real Estate
    Volatility
  • Ratings
    Analyst Color
    Downgrades
    Upgrades
    Initiations
    Price Target
  • Investing Ideas
    Trade Ideas
    Long Ideas
    Short Ideas
    Technicals
    Analyst Ratings
    Analyst Color
    Latest Rumors
    Whisper Index
    Stock of the Day
    Best Stocks & ETFs
    Best Penny Stocks
    Best S&P 500 ETFs
    Best Swing Trade Stocks
    Best Blue Chip Stocks
    Best High-Volume Penny Stocks
    Best Small Cap ETFs
    Best Stocks to Day Trade
    Best REITs
  • Money
    Investing
    Cryptocurrency
    Mortgage
    Insurance
    Yield
    Personal Finance
    Forex
    Startup Investing
    Real Estate Investing
    Prop Trading
    Credit Cards
    Stock Brokers
Research
My Stocks
Tools
Free Benzinga Pro Trial
Calendars
Analyst Ratings Calendar
Conference Call Calendar
Dividend Calendar
Earnings Calendar
Economic Calendar
FDA Calendar
Guidance Calendar
IPO Calendar
M&A Calendar
Unusual Options Activity Calendar
SPAC Calendar
Stock Split Calendar
Trade Ideas
Free Stock Reports
Insider Trades
Trade Idea Feed
Analyst Ratings
Unusual Options Activity
Heatmaps
Free Newsletter
Government Trades
Perfect Stock Portfolio
Easy Income Portfolio
Short Interest
Most Shorted
Largest Increase
Largest Decrease
Calculators
Margin Calculator
Forex Profit Calculator
100x Options Profit Calculator
Screeners
Stock Screener
Top Momentum Stocks
Top Quality Stocks
Top Value Stocks
Top Growth Stocks
Compare Best Stocks
Best Momentum Stocks
Best Quality Stocks
Best Value Stocks
Best Growth Stocks
Connect With Us
facebookinstagramlinkedintwitteryoutubeblueskymastodon
About Benzinga
  • About Us
  • Careers
  • Advertise
  • Contact Us
Market Resources
  • Advanced Stock Screener Tools
  • Options Trading Chain Analysis
  • Comprehensive Earnings Calendar
  • Dividend Investor Calendar and Alerts
  • Economic Calendar and Market Events
  • IPO Calendar and New Listings
  • Market Outlook and Analysis
  • Wall Street Analyst Ratings and Targets
Trading Tools & Education
  • Benzinga Pro Trading Platform
  • Options Trading Strategies and News
  • Stock Market Trading Ideas and Analysis
  • Technical Analysis Charts and Indicators
  • Fundamental Analysis and Valuation
  • Day Trading Guides and Strategies
  • Live Investor Events
  • Pre-market Stock Analysis and News
  • Cryptocurrency Market Analysis and News
Ring the Bell

A newsletter built for market enthusiasts by market enthusiasts. Top stories, top movers, and trade ideas delivered to your inbox every weekday before and after the market closes.

  • Terms & Conditions
  • Do Not Sell My Personal Data/Privacy Policy
  • Disclaimer
  • Service Status
  • Sitemap
© 2026 Benzinga | All Rights Reserved
April 19, 2023 11:34 AM 2 min read

Economic Alarm Bells: A Recession Indicator Just Hit Levels Not Seen Since 1982

by Piero Cingari Benzinga Staff Writer
Follow

ArticleFeaturedTickersList12345!!!

The likelihood of a recession in the United States within the next year has risen to almost 58%, the highest level since August 1982, according to the New York Federal Reserve. 

The recession-risk indicator is now greater than it was in November 2007, just before the subprime-Lehman crisis, when it stood at 40%, and December 2001, when it was at 46%.

Chart: Probability of U.S. Recession Twelve Month Ahead

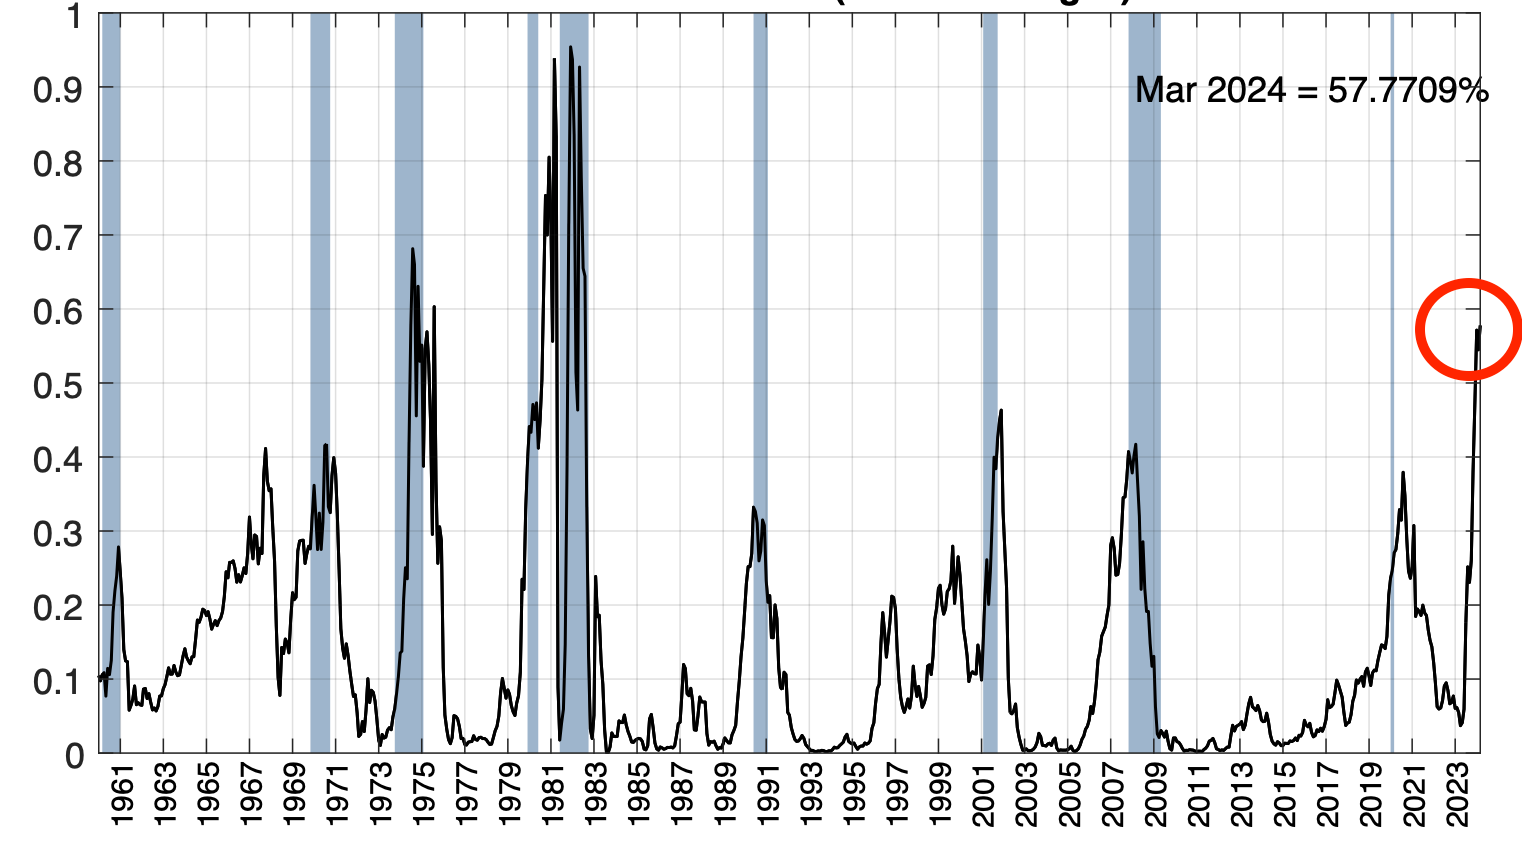
Source: Federal Reserve Bank of New York

Read Also: Economist Lists 3 Recession Red Flags Investors Should Be Watching In 2023

The Bond Yield Curve Slope As Recession Predictor 

The New York Federal Reserve's model uses the yield curve's slope, or "term spread," to predict a U.S. recession twelve months ahead. The term spread used by the New York Fed refers to the gap in yields between the 10-year Treasury bond and the 3-month bill.

When yields on shorter-term bonds are higher than yields on longer-term bonds, the yield curve is considered inverted. 

An inverted yield curve has reliably predicted each of the previous eight U.S. recessions since 1970.

Why Does an Inverted Yield Curve Indicate a Recession?
When a yield curve is inverted, investors fear that the current high level of interest rates, reflected in elevated shorter-term yields, will push the economy into a recession, causing the central bank to cut interest rates in the future, thus discounting presently lower longer-term yields. This is why an inverted yield curve is often a precursor to a recession.

The SPDR Bloomberg 1-3 Month T-Bill ETF (NYSE:BIL), is a popular ETF which offers exposure to the ultrashort end of the Treasury curve, investing in zero coupon U.S. T-Bills with less than three months until maturity.

The iShares 7-10 Year Treasury Bond ETF (NYSE:IEF), instead offers exposure to Treasury bonds with seven to 10 years to maturity. 

Treasury Yield Curve Inversion: Where Are We Now?

In March, the term spread was negative 1.15%, as 10-year rates were around 3.5% and 3-month yields were around 4.65%. The 10-year-3-month yield differential has further worsened to a negative 1.6% at the time of writing, with the 3-month yield jumping to 5.2% and the 10-year yield trading at 3.6%.

If such a spread holds or expands further in April, then the next month's New York Fed recession probability indicator will likely become even more negative than its previous assessment of a 57.8% chance of a recession occurring before March 2024.

Now Read: BofA Fund Manager Survey: Investors Underweight In Stocks Reaches 2009 Crisis Levels

Photo: Shutterstock

Market News and Data brought to you by Benzinga APIs

© 2026 Benzinga.com. Benzinga does not provide investment advice. All rights reserved.

To add Benzinga News as your preferred source on Google, click here.


Posted In:
NewsBondsTreasuriesMarketsETFsNew York FedRecessionTreasuryyield curve
BIL Logo
BILState Street SPDR Bloomberg 1-3 Month T-Bill ETF
Not Available-%
Overview
IEF Logo
IEFiShares 7-10 Year Treasury Bond ETF
$96.21-0.04%
BIL Logo
BILState Street SPDR Bloomberg 1-3 Month T-Bill ETF
Not Available-%
Overview
IEF Logo
IEFiShares 7-10 Year Treasury Bond ETF
$96.21-0.04%
Comments
Loading...