


On Tuesday, Luminar Technologies Inc LAZR announced its lidar solution has been selected to be integrated into the sensor suite of Nvidia Corporation’s NVDA AI vehicle computing platform for autonomous vehicles.
The platform, called DRIVE Hyperion, is slated for production beginning in 2024 and will accelerate the development of autonomous consumer vehicles.
When the markets opened Luminar and Nvidia gapped up 33% and 4.87%, respectively, but both immediately ran into profit-takers who dropped the stocks lower. Traders will want to watch both stocks to see if dip buyers open positions on Luminar and Nvidia intraday to give the stocks bullish momentum.
Want direct analysis? Find me in the BZ Pro lounge! Click here for a free trial
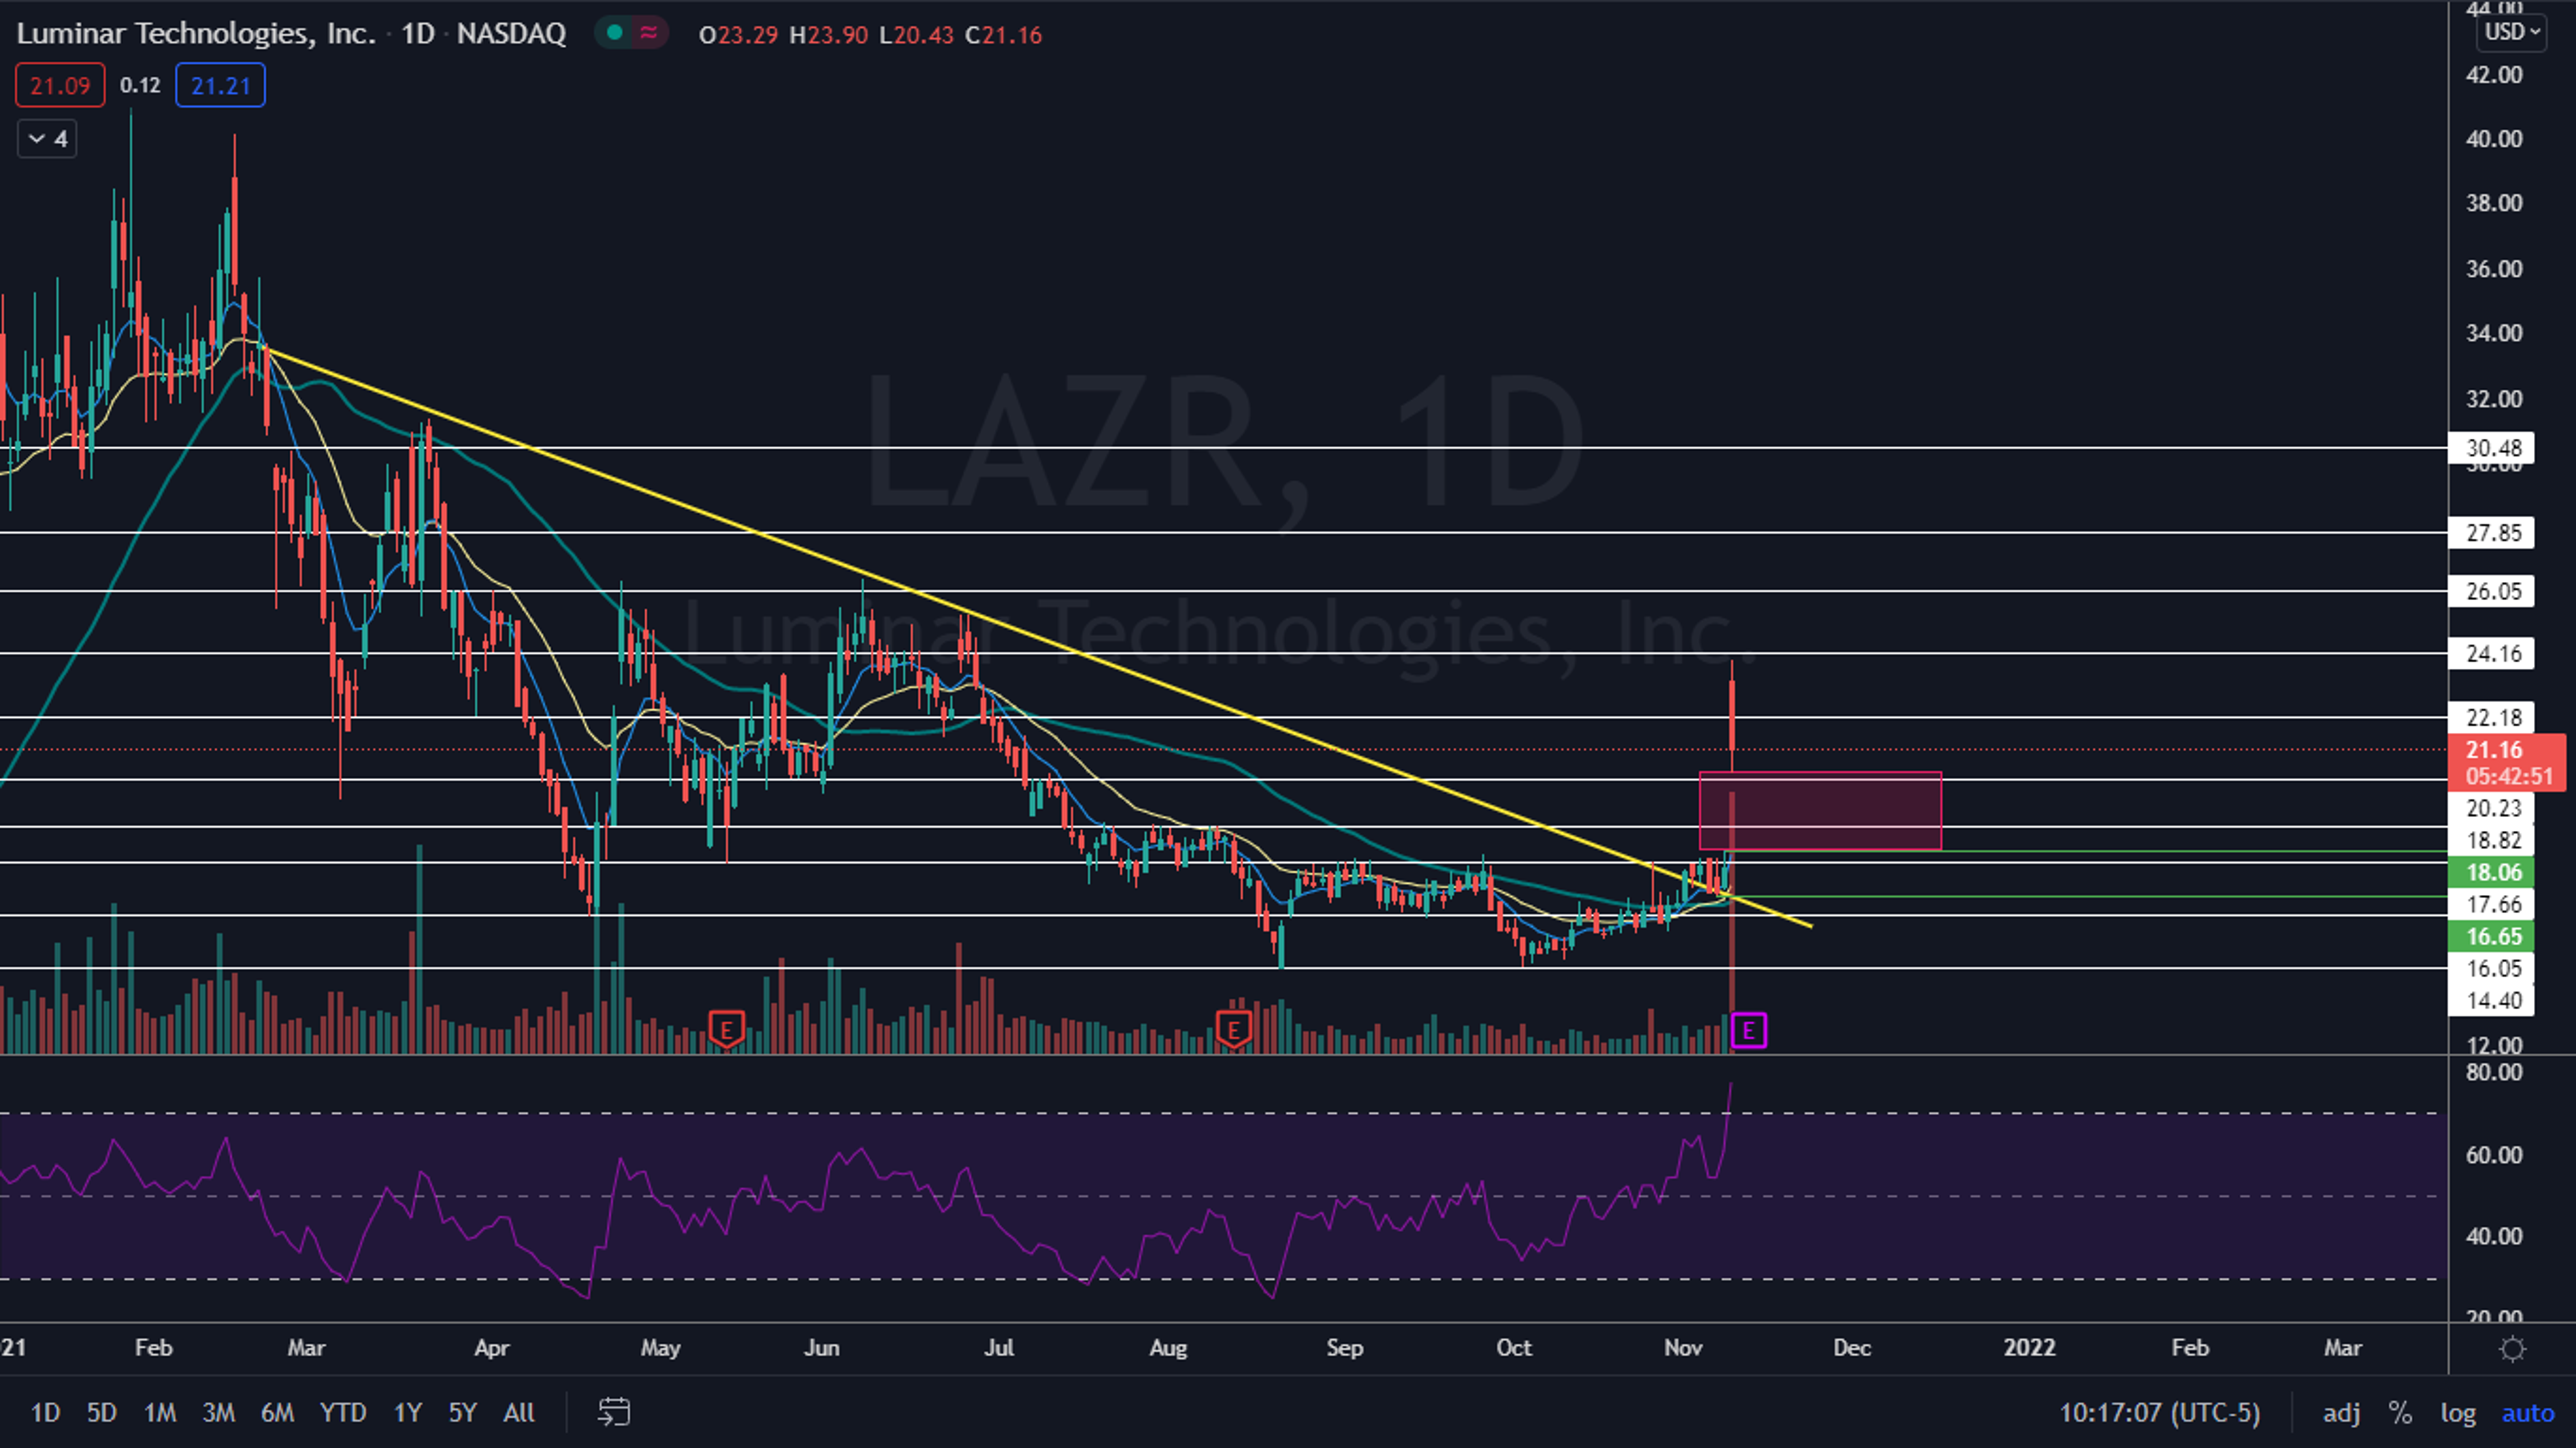
The Luminar Chart: Luminar broke up from a descending trendline on Nov. 1, which had been holding the stock down since Feb. 22. After breaking up from the trendline the stock then back-tested the trendline as support on each of the five days that followed and held above it.
Luminar has been trading in an uptrend since Oct. 4 when the stock formed a bullish double bottom pattern when paired with the price action from Aug. 20. Since the former date, Luminar has made a consistent series of higher highs and higher lows with the most recent higher low printed on Nov. 5 at the $16.65 mark and the most recent higher high created on Monday at $18.06.
On Tuesday, Luminar opened above three resistance levels but fell over 12% within the first half hour of the trading session to a low of $20.43 is now but not near enough to fill the entire gap below between $18.06 and $20.46. Gaps on charts fill about 90% of the time so it is likely Luminar will trade down the $18 mark in the future.
Luminar is trading above the eight-day and 21-day exponential moving averages (EMAs), with the eight-day EMA trending above the 21-day, both of which are bullish indicators. The stock is also trading above the 50-day simple moving average (SMA), which indicates longer-term sentiment is bullish.
The stock has resistance above at $22.18 and $24.16 and support below at $20.23 and $18.82.

The Nvidia Chart: Nvidia has been running north in blue skies since Oct. 25 when the stock busted up through the Aug. 30 previous all-time high of $230.43. After breaking through the previous all-time high resistance, Nvidia soared over 35% to a Nov. 4 all-time high of $314.
The following day, Nivida attempted to break through to another new all-time high but rejected and wicked from the level. On Monday, the stock traded slightly lower in consolidation but in the premarket on Tuesday, Nvidia created another new all-time high.
On Tuesday, Nvidia fell to close the gap left from its opening price, but was holding above support of the previous all-time high. The stock has two gaps below, however, which are likely to be filled at some point in the future. The closest gap, which was left behind on Nov. 4 between $267.84 and $271.18 and a lower gap that falls between $233.55 and $239.24.
Nvidia is trading well above the eight-day and 21-day exponential moving averages, with the eight-day EMA trending above the 21-day, both of which are bullish indicators. Like Luminar, the stock is also trading well above the 50-day simple moving average.
Nvidia’s only resistance above is at the all-time high of $323.10 and the stock also lacks daily support below, with the closest support falling at $314 and the next closest support much lower at about $252.

Edge Rankings
Price Trend
© 2025 Benzinga.com. Benzinga does not provide investment advice. All rights reserved.
Trade confidently with insights and alerts from analyst ratings, free reports and breaking news that affects the stocks you care about.

