FREIGHTWAVES' SONAR CHART OF THE WEEK (Dec 30 -Jan 5, 2019)
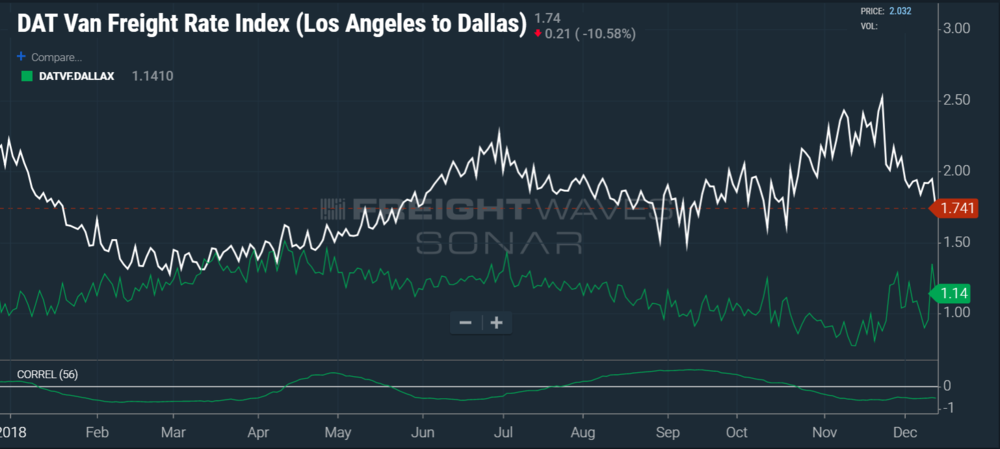
The relationship between east and west freight is apparent in 2018. (SONAR chart of DATVF.LAXDAL and DATVF.DALLAX)
The Los Angeles market has been the catalyst for numerous freight market disruptions over the past two years. The spot market rate for moving a truckload from Los Angeles to Dallas is currently moving in the opposite direction from the return trip rate from Dallas to Los Angeles. The relationship between these two markets told us the general condition of the freight market in 2018. After the two rates converged in early spring, they bounced off each other and never met again.
Chart of the Week: DAT Van Freight Rate Indices L.A. to Dallas and Dallas to L.A. (SONAR:DATVF.LAXDAL, DATVF.DALLAX)
L.A. is one of the most important markets to understand if not the most important due to its ability to impact the national freight market rapidly. When you combine the L.A. and Ontario freight markets, they represent roughly 6-8% of the entire volume in the U.S.
Dallas is the halfway point between the East and West coasts. The Dallas-Fort Worth market represents roughly 4-4.5% of the total freight volume in the country. Dallas is the closest large – top 10 – freight market to L.A. When L.A. volume surges, it is difficult for carriers to position their trucks from the east to the west. Dallas provides some of the best opportunities to do this by having a decent outbound and inbound market from both sections of the country.
This May L.A. volumes surged, and even though Dallas was entering its peak time of year rates came down heading to southern California. Instead of making the Dallas shipper pay for the move west, carriers loaded the rate back east. Carriers can get to Dallas more easily than they can get to L.A. The L.A. market is also unpredictable and essentially on an island. Dallas is the closes top 10 freight market to the city and it is 1400 miles away.
True to form, freight started coming out of southern California in abundance with the inbound containers pouring in after the Chinese New Year was over. The western ports have been flooded with inbound containers this year due to tariff concerns amid the trade war with China. For this reason, L.A. was a bellwether for disruption in 2018.
Unexpectedly, the volume kept coming in late into the fall, with record port volume reported in September and October for the ports of Los Angeles and Long Beach. Carriers kept rates low moving from east to west and relatively high coming back east. You can see the confusion in the rate in September as the daily rate fluctuates wildly. The Dallas to L.A. rate fluctuation is much smaller. This volatility is a sign of an uncertain market.
With the tariff deadline extended into 2019, this lane will be an important one to watch in the first quarter. Chinese New Year is on February 5th, meaning shippers will have to get the freight on the boat before that date to have enough time to get off the boat and through customs. With so much freight having filled warehouses this year, the question will be is there enough room for another round of inbound containers?
About Indices presented in this article
DATVF DATVF.DALLAX) DAT Freight Rate Index - Los Angeles to Dallas and Dallas to Los Angeles - The DAT Van Freight Rate Indices were developed for the purpose of financially settling freight futures launching in March of 2019. The index provides a clear view of base dry van rate behavior, excluding assesorial charges and fuel among other variable items. Looking at rates from a historical perspective provides insight into market behavior. SONAR offers seven lanes a representing 22% of the total freight volume but impacting over 80% of the U.S. freight market capacity.
(About Chart of the Week)
The FreightWaves Chart of the Week is a chart selection from SONAR that provides an interesting data point to describe the state of the freight markets. A chart is chosen from thousands of potential charts on SONAR to help participants visualize the freight market in real-time. Each week the Sultan of SONAR will post a chart, along with commentary live on the front-page. After that, the Chart of the Week will be archived on FreightWaves.com for future reference.
SONAR aggregates data from hundreds of sources, presenting the data in charts and maps and providing commentary on what freight market experts want to know about the industry- in real time.
The FreightWaves data-science and product teams are releasing new data-sets each week and enhancing the client experience.
To find out more about SONAR go here or to setup a demo click here.
© 2024 Benzinga.com. Benzinga does not provide investment advice. All rights reserved.
Comments
Trade confidently with insights and alerts from analyst ratings, free reports and breaking news that affects the stocks you care about.

