July is upon us and that means it is time to update our monthly seasonality report. Here we look at the S&P 500 over the last 50 years and decipher some of the fresh data. Here's the highlights.
Fresh Data Highlights
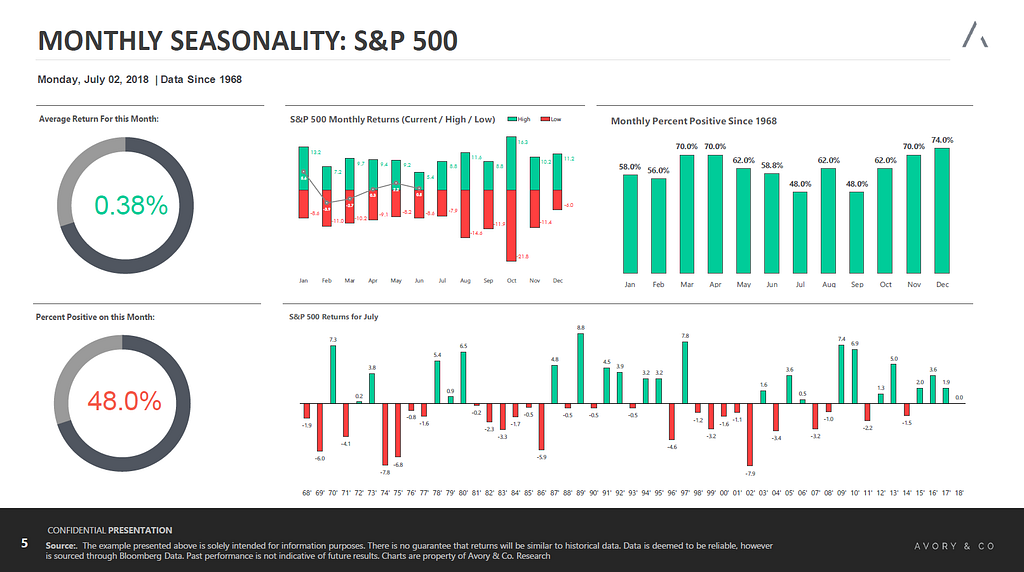
- July is up only 48 percent of the time, tied with September for the worst month.
- The average return for July is 0.38 percent.
- July is up 3 years in a row, tied for the longest streak over a 50 year period. The prior streak started in 1978 and ended in 1981 with a mere 0.2 percent decline.
- July 2nd is historically the 5th worst day of the month.
- The 1978 positive July streak led to the longest negative July streak on record, which entailed 6 negative July's in a row.
- The worst July return ever was -7.9 percent in 2002, the second best max drawdown for any month. December is the best at only negative 6 percent max drawdown.
- If you only invested in July since 1968, you would just be up roughly 20 percent.
- From Jan to June the market is below the typical annual seasonality.
- The 3rd quarter is the worst quarter, in terms percent positive, up 62 percent of the time.
- The 3rd quarter averages a 0.72 percent return.
Related Links:
No Time For Summer Vacation: The Stock Market Has Been Red Hot In The Month Of July
Analyst Says One Word Will Dominate Markets In The Second Half Of 2018: 'Recession'
© 2024 Benzinga.com. Benzinga does not provide investment advice. All rights reserved.
Comments
Loading...
Benzinga simplifies the market for smarter investing
Trade confidently with insights and alerts from analyst ratings, free reports and breaking news that affects the stocks you care about.
Join Now: Free!
Already a member?Sign in

