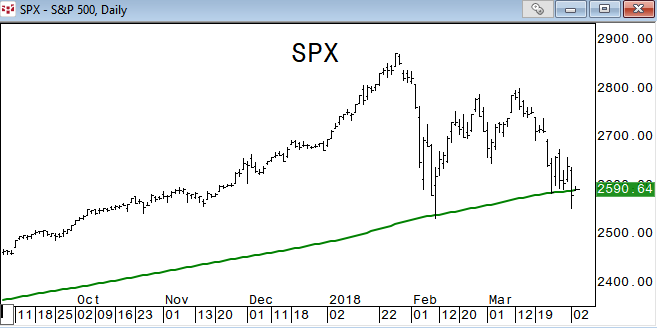
The break of the 200 day moving average in SPX happened on a day when most of Europe was still on holiday, which made it a perfect storm for such an event. Now that everyone is back in the saddle today we may see dip buyers try to regain this emotional level, but there are other things to consider for a potentially bigger move lower. Normally, technicians look for a two day close below a key level like this for confirmation. Yesterday was day one.
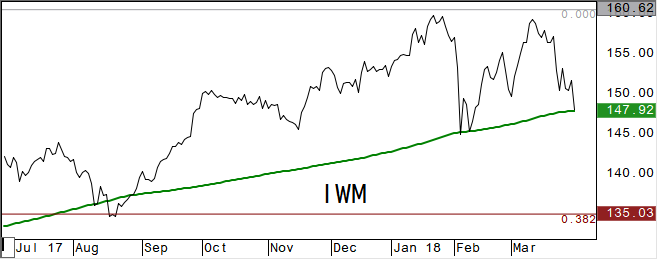
For instance, we still have the 200dma in small cap indices like iShares Russell 2000 Index IWM. IWM settled just above its 200dma which has held on both the February spike lows. It was broken back in August, but once it settled back above, it rallied sharply. (All charts were taken before the market open today).
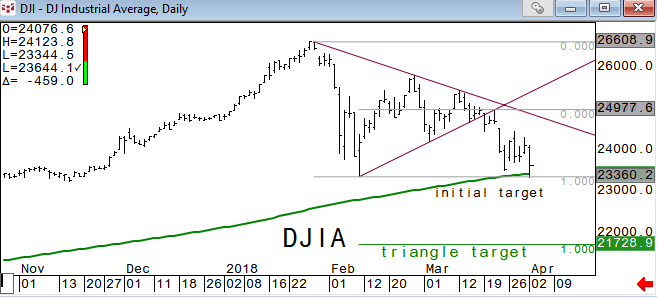
The DJIA traded slightly below the Feb low and its 200dma yesterday before shorts covered late. A clean break and settle of the 200dma would set up for a test of the triangle formation breakout target of 21730. For now we can look for this area to hold until Friday’s employment report.
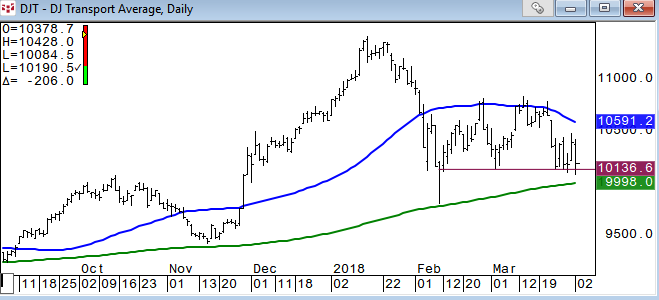
Dow Transportation Average was able to hold above the Feb low close of 10136, which is pivotal for Dow theory proponents. The 200dma is just below and we will look for that to be important support
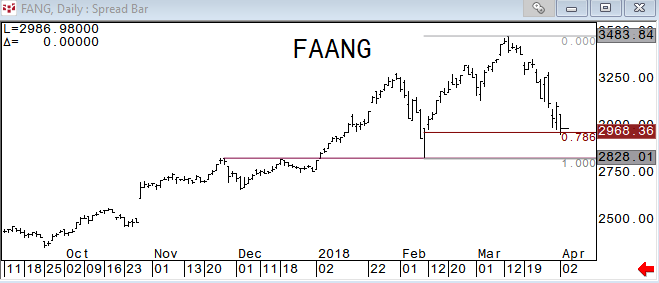
Most of the nervousness surrounding stocks recently has been coming from the tech sector stemming from Facebook, Inc. FB and Amazon.con, Inc. AMZN issues. If the President can leave AMZN alone from his tweets for a day or two we may be able to see a bounce. I don't think Trump cares whether the stock market goes up or down as much as he likes to believe that he has control over it. Maybe something like a small bump up in postal fees to Amazon would be enough for the President to declare victory. We like to use Fibonacci .786 retracements as potential reversal areas. The FAANG bucket held its .786 retracement yesterday.
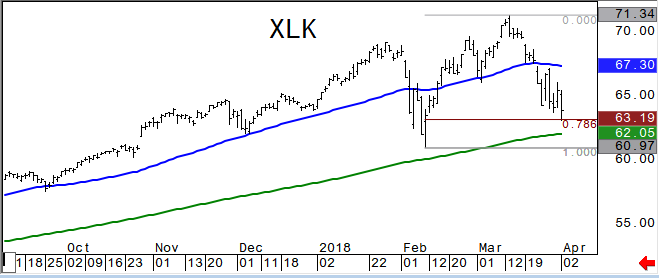
Technology Select Sector SPDR Fund XLK also hit the short term .786 retracement support yesterday before firming off the session lows. It’s 200 day is just below at $62.05 and has not been below its 200dma since June 2016 when it had a two day settle below before rallying. So, once this key moving average is broken it becomes a short covering spring board back above it.
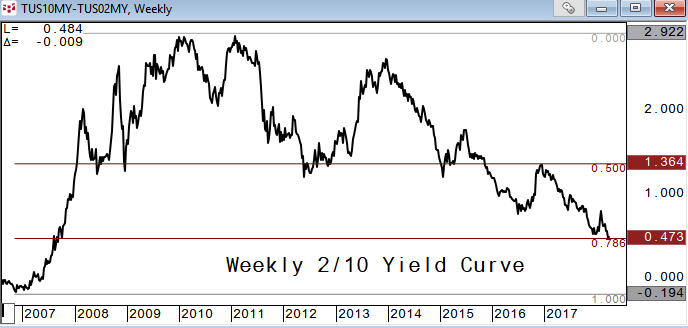
High correlations among sectors can be a problem when there is market weakness as there just isn’t anywhere to hide. We need to see some rotation from one sector to another and find a market leader. Banks are finding it difficult to rally with the yield curve flattening to levels not seen since 2007. The 2/10 yield curve is hovering around the potential reversal area (.473 percent is the .786 retrace from the 2006 low). If the curve can strengthen from here it would help shares in the bank and financial sector.
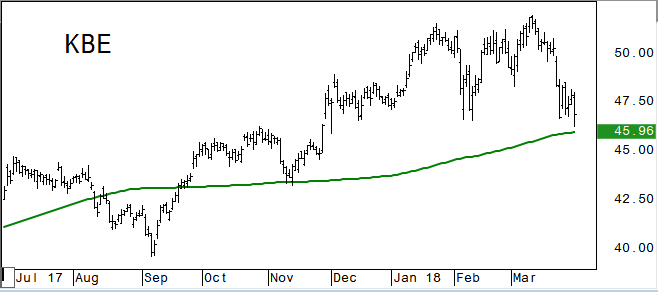
The SPDR KBW Bank KBE is holding above its 200dma which has been a decent closing pivotal pt. XLF traded below its 200dma of 26.71 but was able to close back above it. The last breach of the 200dma in XLF was September where it had a one day break and settle before rallying sharply.
With the height of earnings season about two weeks away, the market is missing its primary dip buyers coming from corporate buybacks. Companies must refrain from buying their own shares during the current period until four days after they have posted earnings. So for now, investors will have to take the lead until they come back.
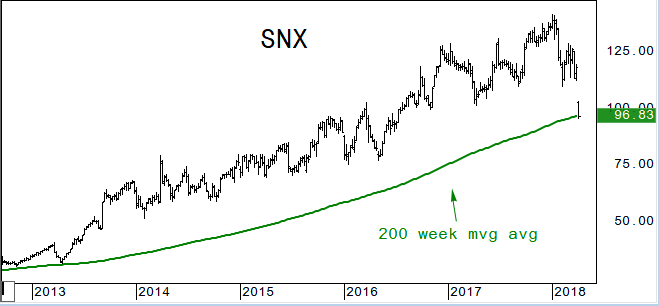
SYNNEX Corporation SNX fell more than -18 percent yesterday, touching its 200 week moving average for the first time since September 2011. The business process services company reported a top-and-bottom-line beat in its first quarter report but guided its second quarter EPS lower, hitting the stock. We will look to see if dip buyers show up around this pivotal support area, after all, it’s a big dip (-32 percent from the year high).
 <
<
Another concern for equities has been the rally in the bond market. With the Fed raising rates what do fixed income traders see? Is it the end of the cycle in stocks, trade war concerns, lack of inflation? Take your pick, but the long bond future has rallied all the way back to its 200 week moving average which has been a very pivotal technical level. Part of the reason that stocks fell in February was on concerns of higher rates, especially the long end. Well those fears have been put to rest. Look for this area in USM8 to hold for now, and maybe a while.

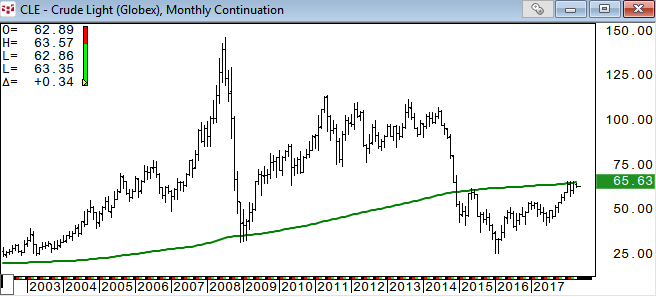
Crude Oil is finding some resistance around its 200 month moving average. Although it hasn’t been perfect, it is an area that will likely pose some trouble to break through. If crude oil weakens from here, don’t look for energy stocks to be a leader in equities as they have been underperforming even with recent strength in crude.
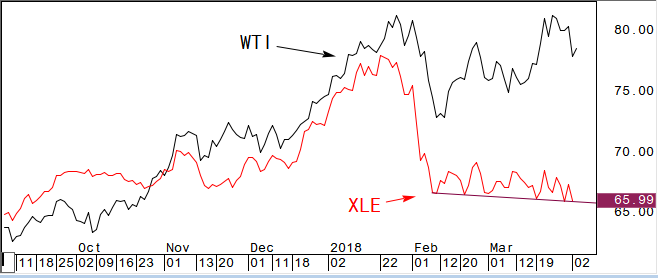
Energy Select Sector SPDR XLE held the closing trend line support yesterday, so some hope here for energy to get abounce.
Volatility is here to stay it seems, as the Fed is more focused on the economy than the market volatility. The days of statements from Fed governors to help stabilize risk assets is all but gone. Enjoy the ride.
David Wienke is the editor of Keystone Charts. More than 30 years of experience providing technical analysis and execution services to institutional clients is now provided in a daily newsletter, The Daily Game Plan. Coverage includes equities, rates, currencies, and commodities. Dave is also an introducing broker with Capital Trading Group, LLLP (CTG); a Chicago based investment firm specializing in execution and account management for CTAs and individual investors. Charts are created using CQG, a top of the line trading and charting service. For a free trial of the Daily Game Plan newsletter email me at dave@keystonecharts.net or go to Capital Trading Group to subscribe.
© 2024 Benzinga.com. Benzinga does not provide investment advice. All rights reserved.
Comments
Trade confidently with insights and alerts from analyst ratings, free reports and breaking news that affects the stocks you care about.

