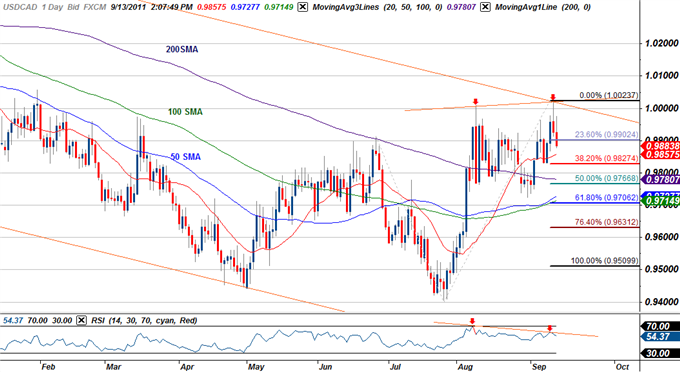
A daily chart shows clear RSI divergence after the pair tested upper-bound trendline resistance of the long-term descending channel dating back to May 2010. A downward sloping RSI suggests further downside moves with a dip below the 50-mark which has held since early August. The recent surge in the greenback is likely to taper off in the coming sessions after the Dow Jones FXCM Dollar Index (Ticker USDOLLAR) rebounded off of the key 38.2% Fibonacci resistance today. Stronger crude prices also support our bias with NYMEX crude advancing more than 2% in New York. Accordingly our bias on this scalp will be weighted to the downside noting that the 20-day moving average at 0.9857 could provide some interim support before continuing down through our scalp levels.

A 30min chart shows the pair breaking below the 38.2% Fibonacci extension taken from the August 9th and September 12th crests at 0.9915early in North American trade. Preferred short entry targets rest here with subsequent ceilings seen at 0.9940 and the 23.6% extension at 0.9960. Profit targets are held at the 61.8% extension at 0.9850 backed by 0.9830, and the 76.4% extension at 0.9809.
Key Thresholds
With a 1-hour average true range of 24.64 profit targets on said scalp should be between 18-23 pips depending on entry. We reckon a break above 0.9980 negates the bias with such a scenario eyeing topside targets at parity and 1.0020.
Note the scalp will not be active until a confirmed break below the 0.9880 or a rebound off 0.9915.Once the scalp is active the levels will remain in play until such time when either of the topside/bottom limit targets are compromised.
|
Entry/Exit Targets |
Timeframe |
Level |
|
Resistance 1 Target |
30min |
0.9915 |
|
Resistance 2 Target |
30min |
0.9940 |
|
Resistance 3 Target |
30min |
0.9960 |
|
Topside Limit |
30min |
0.9980 |
|
Topside Limit Break-Target |
30min |
1.0020 |
|
Support 1 Target |
30min |
0.9850 |
|
Support 2 Target |
30min |
0.9830 |
|
Support 2 Target |
30min |
0.9809 |
|
Bottom Limit |
30min |
0.9780 |
|
Bottom Limit Break-Target |
30min |
0.9750 |
Reference Values
|
Indicator |
Timeframe |
Level |
|
50-SMA |
Daily |
0.9728 |
|
100-SMA |
Daily |
0.9715 |
|
200-SMA |
Daily |
0.9780 |
|
RSI |
Daily |
54.06 |
|
Average True Range (14) |
1hour |
24.64 |
Related Economic Data Releases
Event risk on said scalp rests primarily with the greenback, highlighted by the August PPI, advanced retail sales, and business inventory reports on tap for tomorrow. Consensus estimates call for producer prices and retail sales to soften last month while business inventories are expected to climb by 0.5% for the month of July. With investor confidence remaining extremely fragile after Friday's rapid sell-off, a weaker than expected print on tomorrow's data risks upsetting our bias as traders once again flock into the safety of the dollar. We will continue to closely monitor the dollar index for a topside break of the key 38.2% Fibonacci extension at 9745 as a breach of this level is likely to see the USD/CAD pair higher in the interim.
Upcoming Events
|
Country |
Date |
GMT |
Importance |
Release |
Expected |
Prior |
|
CAD |
9/14 |
12:00 |
LOW |
Capacity Utilization Rate (2Q) |
78.0% |
79.0% |
|
US |
9/14 |
12:30 |
LOW |
Producer Price Index (MoM) (AUG) |
0.0% |
0.2% |
|
US |
9/14 |
12:30 |
MEDIUM |
Producer Price Index (YoY) (AUG) |
6.5% |
7.2% |
|
US |
9/14 |
12:30 |
LOW |
Producer Price Index Ex Food & Energy (MoM) (AUG) |
0.2% |
0.4% |
|
US |
9/14 |
12:30 |
MEDIUM |
Producer Price Index Ex Food & Energy (YoY) (AUG) |
2.6% |
2.5% |
|
US |
9/14 |
12:30 |
HIGH |
Advance Retail Sales (AUG) |
0.2% |
0.5% |
|
US |
9/14 |
12:30 |
MEDIUM |
Retail Sales Less Autos (AUG) |
0.2% |
0.5% |
|
US |
9/14 |
12:30 |
MEDIUM |
Retail Sales Less Auto & Gas (AUG) |
0.3% |
0.3% |
|
US |
9/14 |
14:00 |
MEDIUM |
Business Inventories (JUL) |
0.5% |
0.3% |
Written by Michael Boutros, Currency Analyst for DailyFX.com
To contact the author of this report or subscribe to their daily analysis, please send inquiries to:mboutros@dailyfx.com
You can also follow Michael on Twitter @MBForexfor updates on this scalp and other trades.
© 2024 Benzinga.com. Benzinga does not provide investment advice. All rights reserved.
Comments
Trade confidently with insights and alerts from analyst ratings, free reports and breaking news that affects the stocks you care about.

