


Marathon Digital Holdings, Inc MARA and Riot Blockchain, Inc RIOT have both formed daily chart patterns that could provide clues to their future direction. On Monday, Mara and Riot were printing possible reversal candlesticks that are often found at the bottom of a downtrend.
Both stocks have plummeted over the past 6 weeks with Mara trading down over 60% from its Nov. 9 all-time high of $83.45 and Riot losing 52% of its value since reaching its high of $46.28 on Nov. 15.
Marathon and Riot are affected by the cryptocurrency market and the general market, which have both been in turmoil. Apex cryptocurrency Bitcoin BTC/USD has fallen 32% off its Nov. 10 all-time high of $69,000 while the SPDR S&P 500 has retraced about 4% from its all-time high of $473.54 printed on Nov. 22.
On Monday, Marathon and Riot were printing possible reversal candlesticks that are often found at the bottom of a downtrend but it should be noted that events affecting the direction of the general markets and news headlines about a stock can quickly invalidate patterns.
As the saying goes, "the trend is your friend until it isn't" and any trader in a position should have a clear stop set in place and manage their risk versus reward.
A Look At Bitcoin: Bitcoin has been trading in a downtrend since reaching its all-time high but on Friday, Saturday and Monday bounced off the $45,496 level, which has created a bullish triple bottom pattern.
- If Bitcoin falls below the level, it will confirm the downtrend is still intact, which would likely negate the reversal candlestick on Marathon and Riot’s charts.
- If the crypto is able to hold above the level and consolidate sideways the bulls may be able to regain control and force Bitcoin to react to the bullish pattern.
- To reverse course, Bitcoin must first regain the eight-day exponential moving average as support and if the crypto can it has room to push up through a falling channel it’s been trading in since Dec. 7.
Want direct analysis? Find me in the BZ Pro lounge! Click here for a free trial.
The Marathon Chart: By midafternoon on Monday Marathon was working on printing a doji candlestick on the daily chart, which can signal a reversal to the upside.
- Marathon’s relative strength index (RSI) indicates the stock is in for at least a bounce as it’s measuring in low at the 32% mark. When a stock’s RSI nears or reaches the 30% level it becomes oversold, which can be a buy signal for technical traders.
- Marathon has resistance above at $34.41 and $38.89 and support below at $30.55 and $27.13.


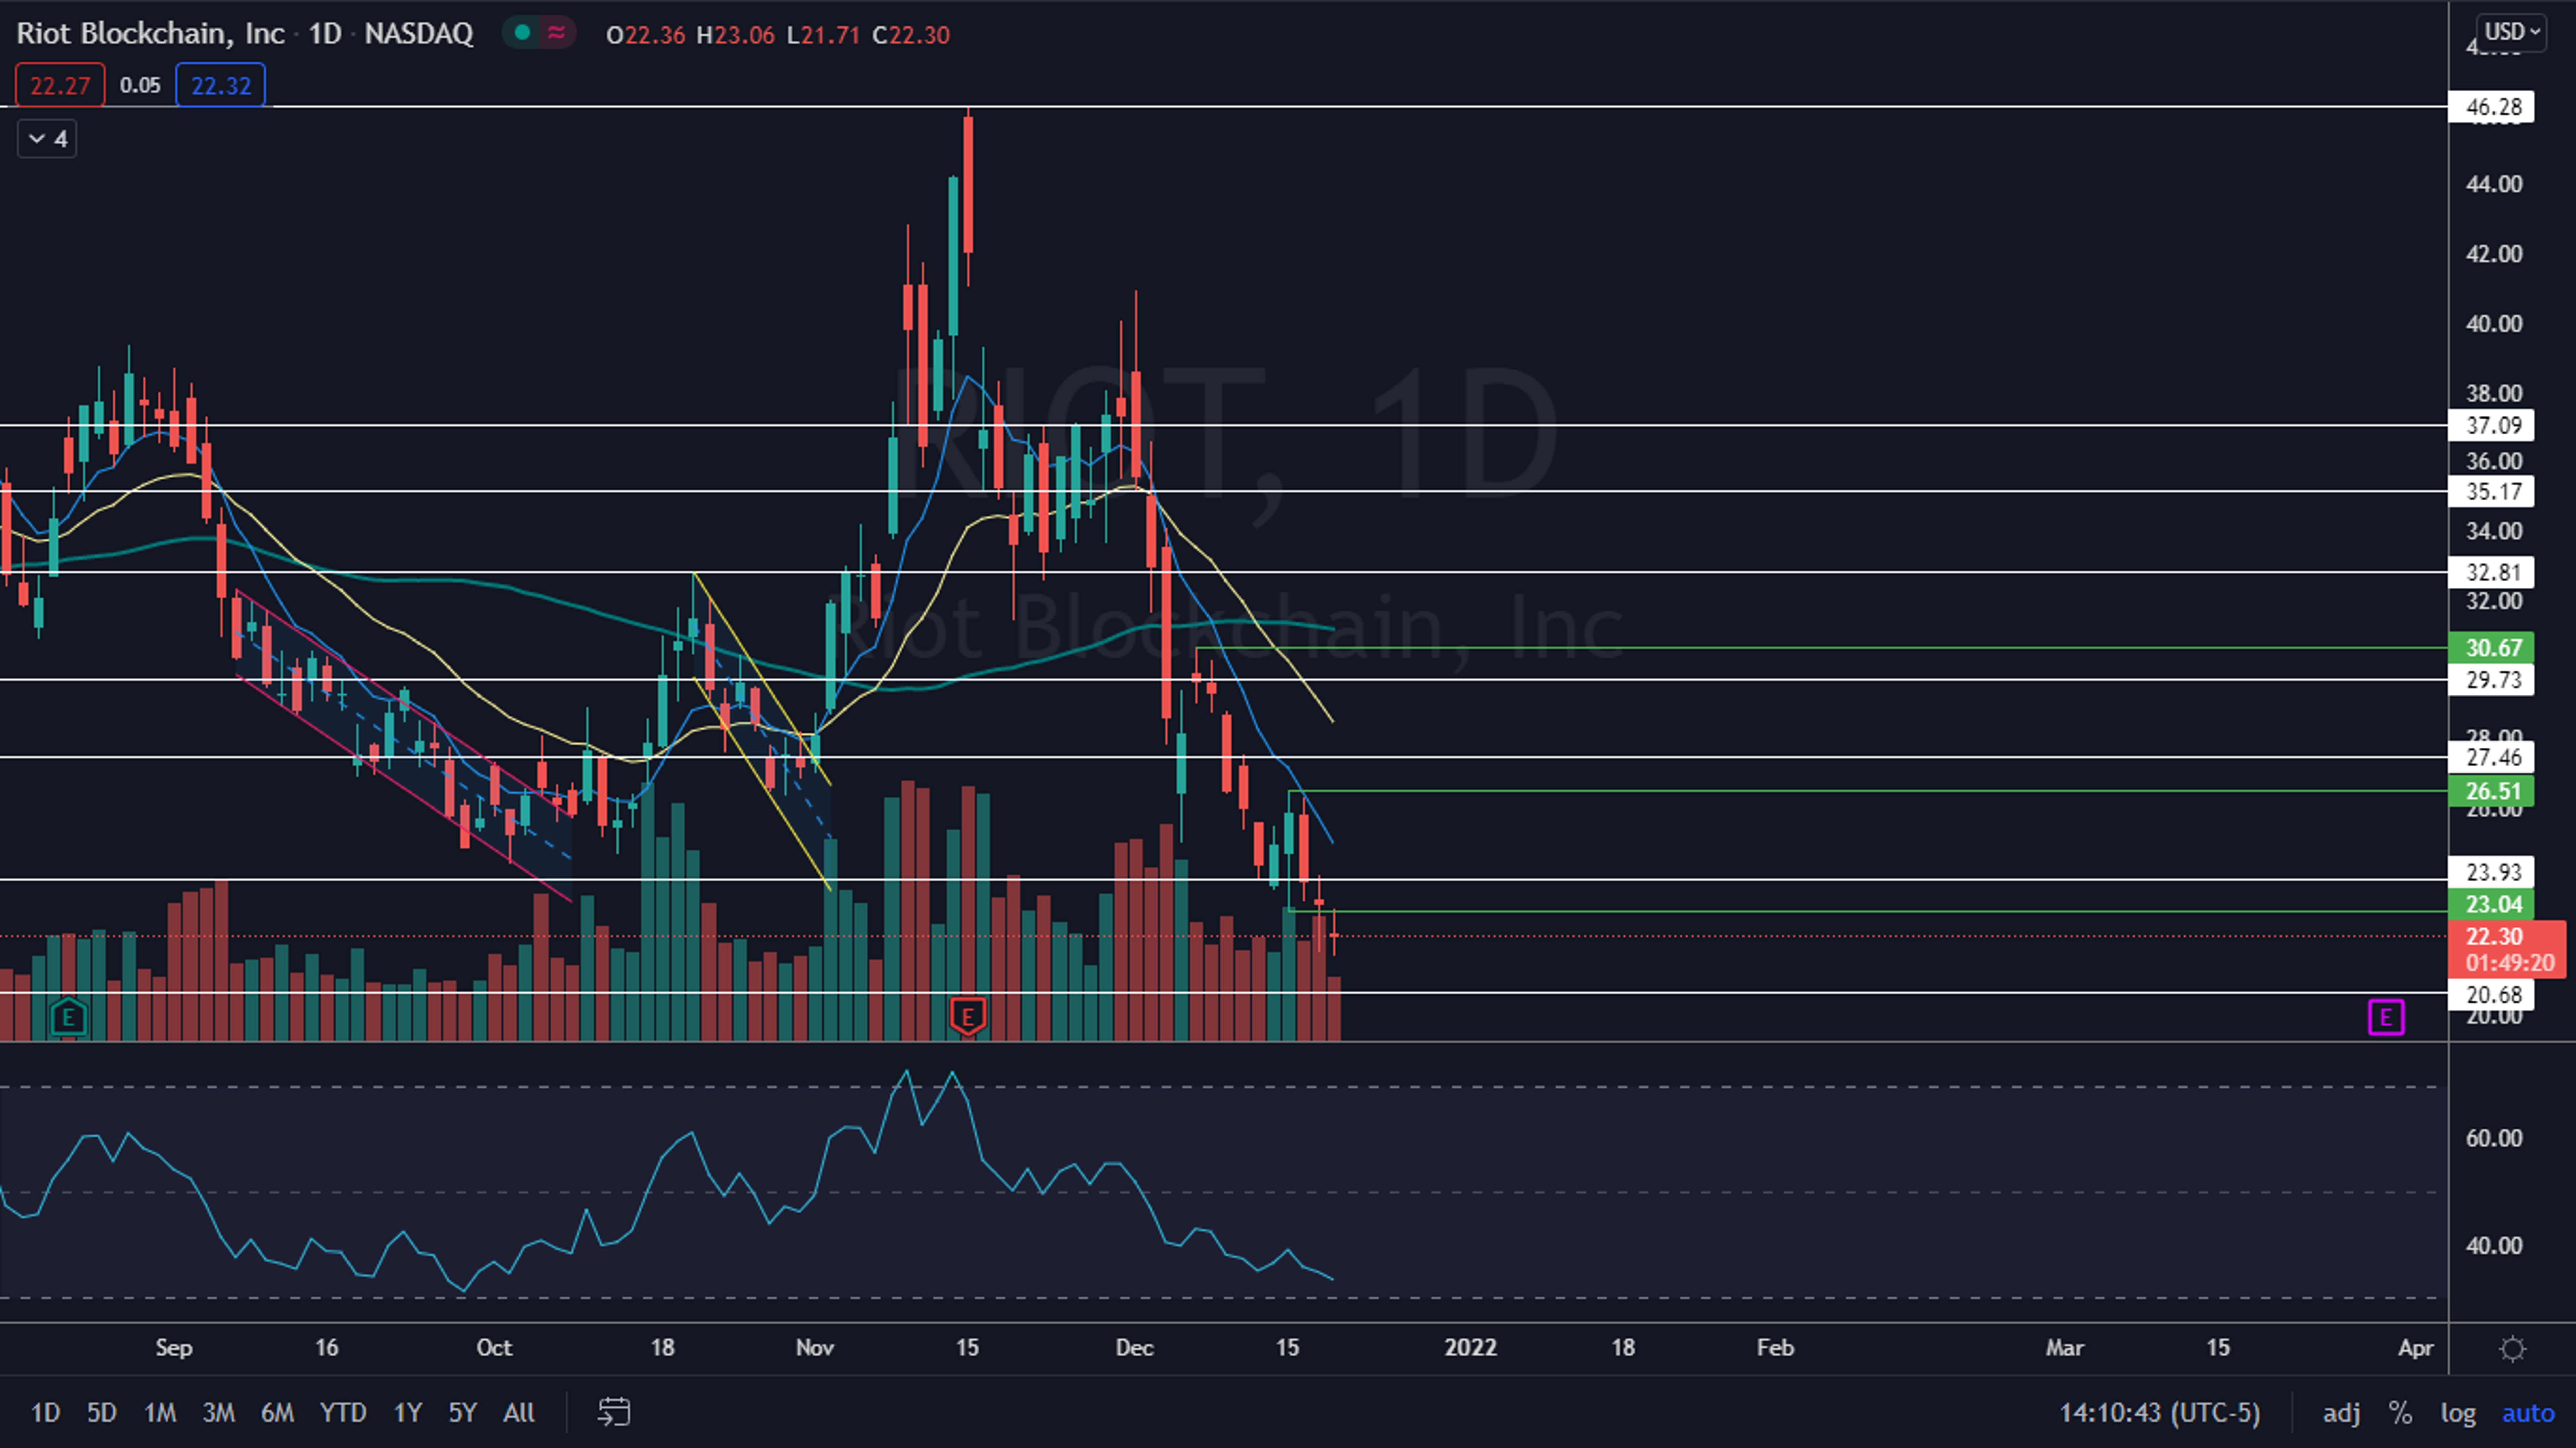
The Riot Chart: Riot’s daily candle on Monday was switching between an inverted hammer candlestick and a doji candlestick, both which are reversal candles when found at the bottom of a downtrend.
- Like Marathon, Riot’s RSI is measuring near oversold territory at about the 33% level.
- It should be noted that reversal candlesticks are lagging indicators because Tuesday’s candlestick will need to print before the pattern can be confirmed.
- Riot has resistance above at $23.93 and $27.46 and support below at $20.68 and $17.90.
Edge Rankings
Price Trend
© 2025 Benzinga.com. Benzinga does not provide investment advice. All rights reserved.