
Bitcoin BTC/USD looks to have formed an ascending triangle pattern and is potentially breaking out above.
The recent hype on Bitcoin may be due to Coinbase Global Inc. COIN having its market debut Wednesday.
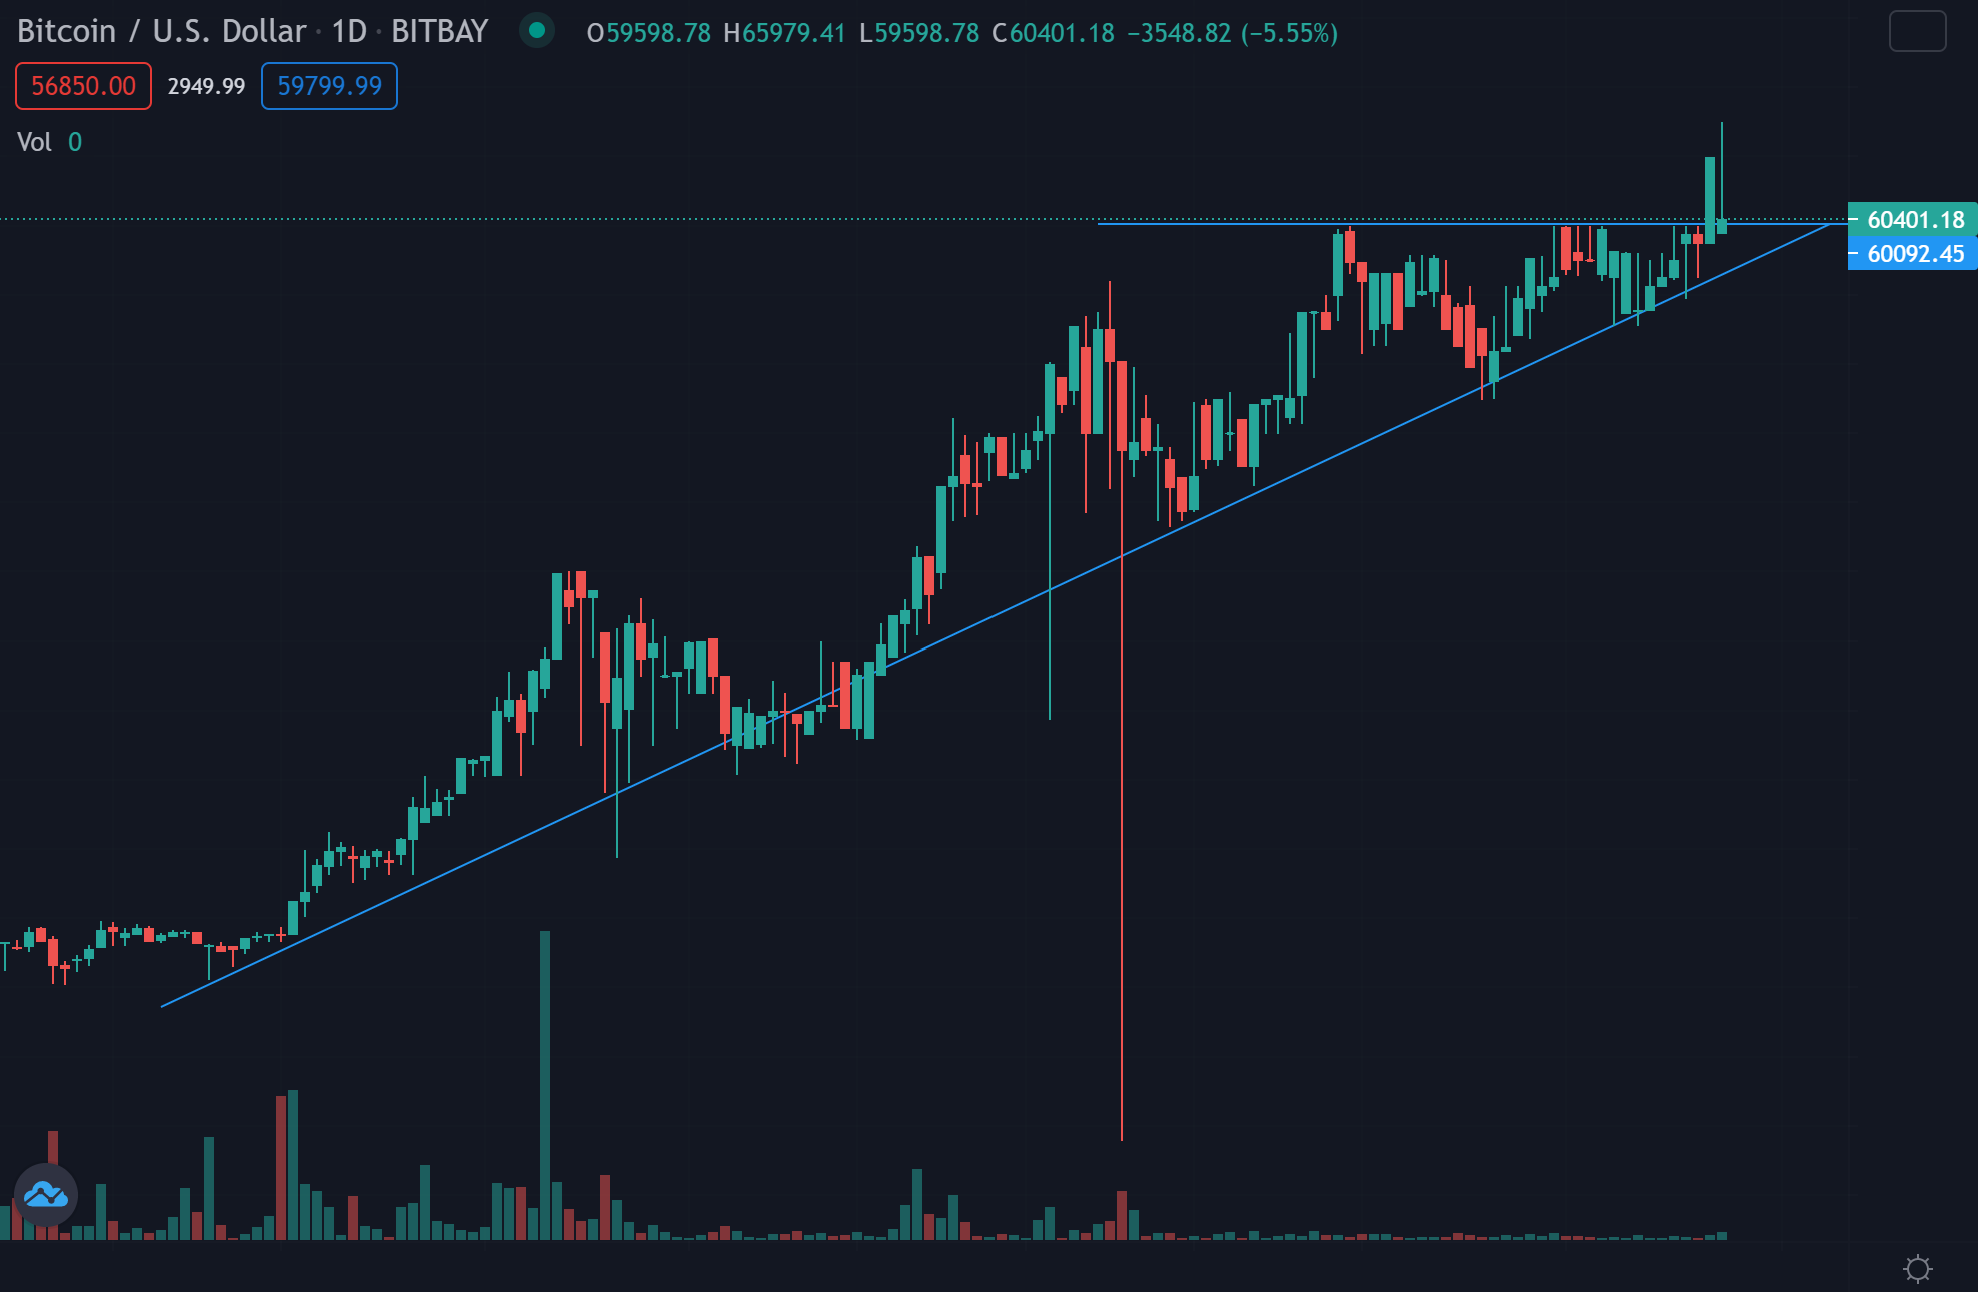
Bitcoin Daily Chart Analysis: The daily chart on Bitcoin shows it may be breaking out of an ascending triangle pattern.
Connecting the lows on the chart shows it has been in an uptrend. Connecting the lows show where the cryptocurrency has found support in the past. This area is somewhere Bitcoin may be able to find support again in the future.
Bitcoin showed a previous resistance near the $60,000 level. Now, as the price is above this level, traders would like to see this area hold as support. Support here could see a push up in the future.
What’s Next For Bitcoin? Bullish traders would like to see Bitcoin continue to form higher lows above the resistance line. Consolidation above the previous resistance may allow Bitcoin to see a higher move in the future.
Bears would like to see Bitcoin stop forming higher lows. An ideal move for bears would be to see Bitcoin drop below the $60,000 resistance and fail to break above again. If Bitcoin were to stop forming higher lows, traders should take caution as there is a chance it could see a dump.
© 2024 Benzinga.com. Benzinga does not provide investment advice. All rights reserved.
Comments
Trade confidently with insights and alerts from analyst ratings, free reports and breaking news that affects the stocks you care about.

